INVITE-ONLY SCRIPT
MagnetOsc Turbo [ZuperView]
MagnetOsc Turbo is a dual-timeframe momentum oscillator that identifies overbought and oversold regions with magnetic precision.
Instead of relying on a single timeframe (like RSI or Stochastics), it compares momentum between your main chart and a higher timeframe to confirm when a move is truly overextended or simply pausing.


It works like a magnet:
This multi-timeframe approach helps you read momentum as a conversation between 2 timeframes, not just a number crossing 80 or 20.
📌Key features
🔸Dynamic multi-timeframe momentum analysis
MagnetOsc Turbo compares 2 oscillators – one from your current chart and one from a higher timeframe that you define.
You can freely select:
By comparing momentum from both frames, it helps you avoid false reversals – moments when one chart screams “Overbought” while the higher timeframe still has strength to push further.
Tip:
Use a higher timeframe that’s 4 – 6× larger than your trading chart:
This keeps your Pull and Push signals balanced and meaningful.
🔸Threshold levels — Defining OB/OS zones
There are 2 sets of thresholds:
These define the Overbought (OB) and Oversold (OS) boundaries.
Default levels (80/20) work for most markets, but:
🔸Pull & Push signal logic
The magnetic principle drives the signal engine:

Both signal types are generated automatically by analyzing oscillator states across timeframes.
However, for better discipline and clarity, it’s recommended to trade only one signal type (Pull or Push) depending on your style.
🔸Built-in price-action confirmation
To reduce false entries, each signal is validated against candle behavior using OHLC data.
This allows MagnetOsc Turbo to recognize strong reversal candles and provide earlier, more reliable entries than lagging oscillators.
You’ll notice that Pull/Push signals often align with the first strong candle after momentum disagreement – a high-probability setup many traders miss with basic RSI or Stochastics.
🔸Clean, intuitive visual interface
The oscillator window is designed for clarity:
When both lines and zones share the same color → Attraction (Pull)
When they differ → Repulsion (Push)
You can literally see the magnetic force – an elegant way to understand what’s happening beneath the candles.
📌Customization
Every market and trader is different, so MagnetOsc Turbo offers deep flexibility:
By tweaking these, you can make the indicator more aggressive or conservative.
Examples:
If your chart looks noisy, increase the OSC Period or enable smoothing.
📌Trading Tips
🔸Choose your style
🔸Define your timeframe pair
A good ratio is 1 : 4–6 between your trading and higher timeframe.
Examples:
🔸Manage frequency
Use Signal Split and Quantity Per Area to prevent over-signaling.
For example, limit to 2 Pull signals per overbought zone – keeping only the cleanest opportunities.
MagnetOsc Turbo transforms a simple oscillator into a multi-timeframe momentum map.
It shows how lower and higher timeframes attract or repel each other, revealing the true rhythm of market energy.
Instead of relying on a single timeframe (like RSI or Stochastics), it compares momentum between your main chart and a higher timeframe to confirm when a move is truly overextended or simply pausing.
It works like a magnet:
- Like poles repel → Push signal = momentum exhaustion (reversal setup)
- Opposite poles attract → Pull signal = short-term reversal within a trend
This multi-timeframe approach helps you read momentum as a conversation between 2 timeframes, not just a number crossing 80 or 20.
📌Key features
🔸Dynamic multi-timeframe momentum analysis
MagnetOsc Turbo compares 2 oscillators – one from your current chart and one from a higher timeframe that you define.
You can freely select:
- Higher-timeframe type: tick, minute, range, volume, day…
- Value ratio: 2×, 3×, 5×, 6×, or 7×…
By comparing momentum from both frames, it helps you avoid false reversals – moments when one chart screams “Overbought” while the higher timeframe still has strength to push further.
Tip:
Use a higher timeframe that’s 4 – 6× larger than your trading chart:
- 100 Tick → 500 Tick
- 1 Min → 5 – 10 Min
This keeps your Pull and Push signals balanced and meaningful.
🔸Threshold levels — Defining OB/OS zones
There are 2 sets of thresholds:
- #1: Hidden (for the lower timeframe)
- #2: Visible (for the higher timeframe)
These define the Overbought (OB) and Oversold (OS) boundaries.
Default levels (80/20) work for most markets, but:
- Tighten zones (70/30) → earlier but more frequent signals.
- Widen zones (80/20) → fewer but higher-quality signals.
🔸Pull & Push signal logic
The magnetic principle drives the signal engine:
Both signal types are generated automatically by analyzing oscillator states across timeframes.
However, for better discipline and clarity, it’s recommended to trade only one signal type (Pull or Push) depending on your style.
🔸Built-in price-action confirmation
To reduce false entries, each signal is validated against candle behavior using OHLC data.
This allows MagnetOsc Turbo to recognize strong reversal candles and provide earlier, more reliable entries than lagging oscillators.
You’ll notice that Pull/Push signals often align with the first strong candle after momentum disagreement – a high-probability setup many traders miss with basic RSI or Stochastics.
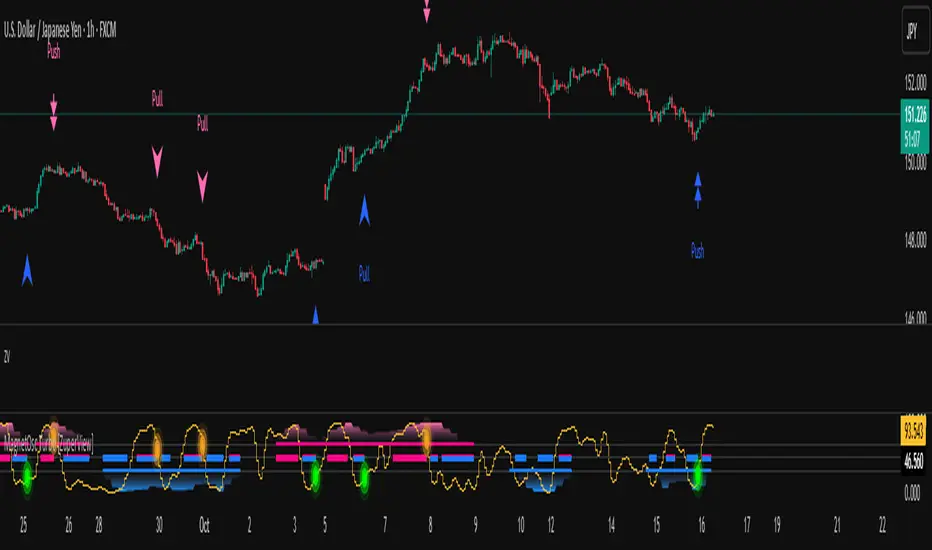
🔸Clean, intuitive visual interface
The oscillator window is designed for clarity:
- Displays both lower- and higher-timeframe momentum in a single panel.
- Colored zones visualize attraction or repulsion between timeframes.
- On-chart markers show exact signal points.
- Toggle Pull/Push signal display as desired.
When both lines and zones share the same color → Attraction (Pull)
When they differ → Repulsion (Push)
You can literally see the magnetic force – an elegant way to understand what’s happening beneath the candles.
📌Customization
Every market and trader is different, so MagnetOsc Turbo offers deep flexibility:
- Choose from 11 types of moving averages for smoothing.
- Adjust oscillator period and smoothing length.
- Control Signal Split (minimum bars between signals).
- Limit the number of signals per OB/OS area via Quantity Per Area.
- Fine-tune thresholds (Upper & Lower for both timeframes).
By tweaking these, you can make the indicator more aggressive or conservative.
Examples:
- Tight thresholds → more signals, faster reactions (scalpers).
- Wider thresholds → fewer but stronger signals (swing traders).
If your chart looks noisy, increase the OSC Period or enable smoothing.
📌Trading Tips
🔸Choose your style
- Scalpers: focus on Pull signals. These appear more often and align with short bursts of counter-momentum.
- Swing traders: focus on Push signals. These highlight exhaustion zones that often precede larger reversals.
🔸Define your timeframe pair
A good ratio is 1 : 4–6 between your trading and higher timeframe.
Examples:
- 100 Tick → 400–600 Tick
- 1 Min → 5–10 Min
🔸Manage frequency
Use Signal Split and Quantity Per Area to prevent over-signaling.
For example, limit to 2 Pull signals per overbought zone – keeping only the cleanest opportunities.
MagnetOsc Turbo transforms a simple oscillator into a multi-timeframe momentum map.
It shows how lower and higher timeframes attract or repel each other, revealing the true rhythm of market energy.
仅限邀请脚本
只有经作者批准的用户才能访问此脚本。您需要申请并获得使用权限。该权限通常在付款后授予。如需了解更多详情,请按照以下作者的说明操作,或直接联系ZuperView。
除非您完全信任其作者并了解脚本的工作原理,否則TradingView不建议您付费或使用脚本。您还可以在我们的社区脚本中找到免费的开源替代方案。
作者的说明
To add the indicator to your chart, click "Indicators" → "Invite-only" → find and select the indicator to add it to the chart.
👉 Explore all indicators & systems: zuperview.com/
👉 Join our Discord: discord.gg/YKE6ujrw59
All content provided by ZuperView is for informational & educational purposes only. Past performance does not guarantee future results.
👉 Join our Discord: discord.gg/YKE6ujrw59
All content provided by ZuperView is for informational & educational purposes only. Past performance does not guarantee future results.
免责声明
这些信息和出版物并不意味着也不构成TradingView提供或认可的金融、投资、交易或其它类型的建议或背书。请在使用条款阅读更多信息。