OPEN-SOURCE SCRIPT
Candlestick Pattern Detector
Candlestick Pattern Detector
Overview
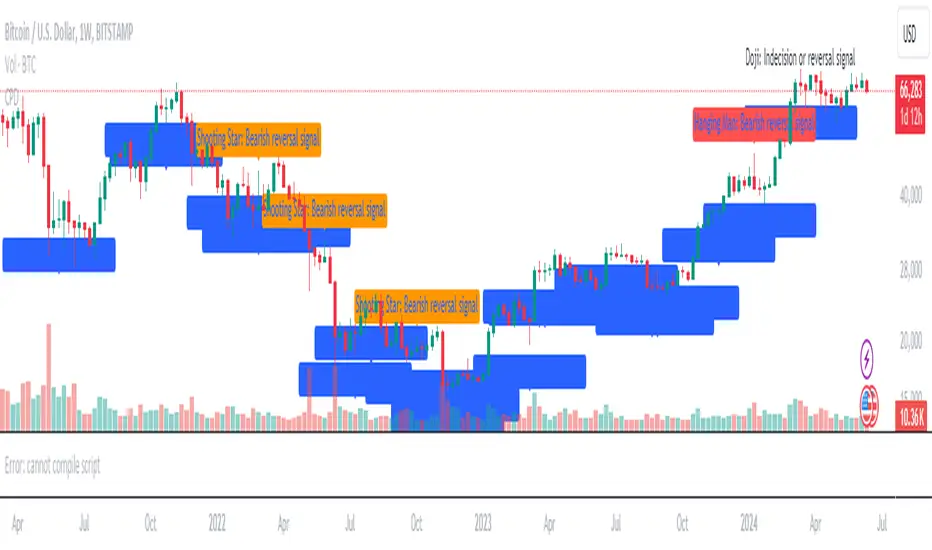
Welcome to the Candlestick Pattern Detector, a powerful tool designed to help traders identify key candlestick patterns on any chart. This indicator detects some of the most significant candlestick patterns and provides brief descriptions directly on the chart, making it easier for you to interpret market signals and make informed trading decisions.
Detected Patterns
Doji
Description: A Doji indicates market indecision. It occurs when the open and close prices are very close, suggesting a balance between bullish and bearish forces.
Signal: Possible trend reversal or continuation depending on the context.
Hammer
Description: A Hammer appears at the bottom of a downtrend, characterized by a small body and a long lower wick. It suggests that buyers are stepping in to push prices higher.
Signal: Bullish reversal.
Hanging Man
Description: The Hanging Man occurs at the top of an uptrend with a small body and a long lower wick. It indicates that selling pressure is starting to take over.
Signal: Bearish reversal.
Shooting Star
Description: The Shooting Star appears at the top of an uptrend with a small body and a long upper wick, indicating that buyers are losing control and sellers may push prices down.
Signal: Bearish reversal.
How to Use
Add to Chart: Click on the "Indicators" button in TradingView, search for "Candlestick Pattern Detector," and add it to your chart.
Visual Signals: The indicator will automatically mark detected patterns with labels on your chart.
Interpret Patterns: Use the brief descriptions provided with each detected pattern to understand market sentiment and potential price movements.
Conclusion
The Candlestick Pattern Detector is a helpful tool for traders of all levels, providing clear and concise information about key candlestick patterns. By integrating this indicator into your trading strategy, you can enhance your ability to read price action and make better trading decisions.
Overview
Welcome to the Candlestick Pattern Detector, a powerful tool designed to help traders identify key candlestick patterns on any chart. This indicator detects some of the most significant candlestick patterns and provides brief descriptions directly on the chart, making it easier for you to interpret market signals and make informed trading decisions.
Detected Patterns
Doji
Description: A Doji indicates market indecision. It occurs when the open and close prices are very close, suggesting a balance between bullish and bearish forces.
Signal: Possible trend reversal or continuation depending on the context.
Hammer
Description: A Hammer appears at the bottom of a downtrend, characterized by a small body and a long lower wick. It suggests that buyers are stepping in to push prices higher.
Signal: Bullish reversal.
Hanging Man
Description: The Hanging Man occurs at the top of an uptrend with a small body and a long lower wick. It indicates that selling pressure is starting to take over.
Signal: Bearish reversal.
Shooting Star
Description: The Shooting Star appears at the top of an uptrend with a small body and a long upper wick, indicating that buyers are losing control and sellers may push prices down.
Signal: Bearish reversal.
How to Use
Add to Chart: Click on the "Indicators" button in TradingView, search for "Candlestick Pattern Detector," and add it to your chart.
Visual Signals: The indicator will automatically mark detected patterns with labels on your chart.
Interpret Patterns: Use the brief descriptions provided with each detected pattern to understand market sentiment and potential price movements.
Conclusion
The Candlestick Pattern Detector is a helpful tool for traders of all levels, providing clear and concise information about key candlestick patterns. By integrating this indicator into your trading strategy, you can enhance your ability to read price action and make better trading decisions.
开源脚本
秉承TradingView的精神,该脚本的作者将其开源,以便交易者可以查看和验证其功能。向作者致敬!您可以免费使用该脚本,但请记住,重新发布代码须遵守我们的网站规则。
免责声明
这些信息和出版物并非旨在提供,也不构成TradingView提供或认可的任何形式的财务、投资、交易或其他类型的建议或推荐。请阅读使用条款了解更多信息。
免责声明
这些信息和出版物并非旨在提供,也不构成TradingView提供或认可的任何形式的财务、投资、交易或其他类型的建议或推荐。请阅读使用条款了解更多信息。