OPEN-SOURCE SCRIPT
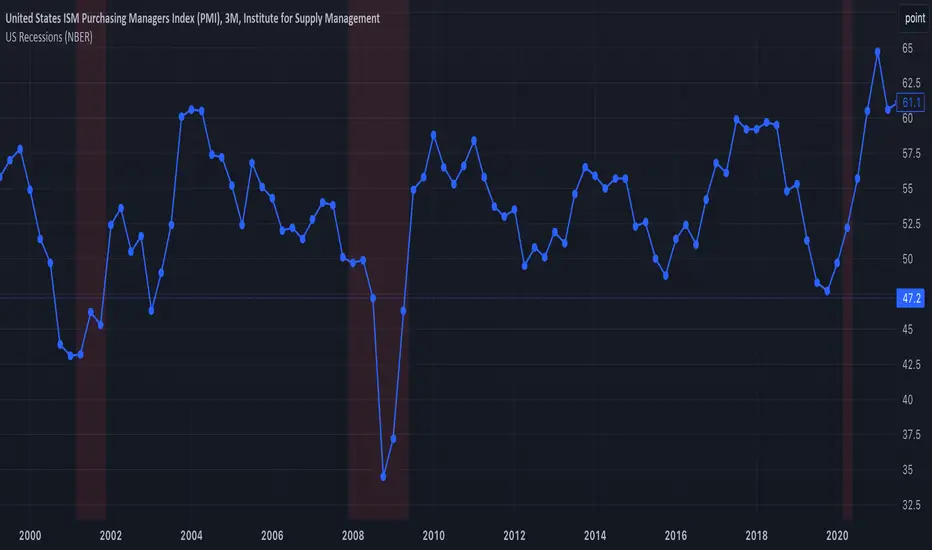
US Recessions (NBER)
This indicator is designed to replace the US Recessions indicator.
Unfortunately, the original indicator is now broken, and the author is not responding: tradingview.com/v/csfFrTe4/ .
There are other similar indicators, but they are not based on live data and either show non-officially recognized recessions or fail to display all officially recognized recessions.
This indicator shades US recession periods based on live monthly data from USREC. It highlights all officially recognized US recessions according to the NBER and will automatically shade any future recessions when they occur. The indicator works across all timeframes, correctly shading recessions whether you are viewing a 30-minute, 2-hour, daily, weekly, or any other chart timeframe.
Warning & Risks:
This indicator uses the barmerge.lookahead_on option to correctly handle monthly recession data from USREC. The purpose of this setting is to ensure that the monthly data points are applied retroactively to the corresponding bars on the chart. However, this means that while past recession periods are accurately shaded, the script is effectively displaying data from future candles and plotting it backward onto the chart.
This behavior does not introduce a “future leak” in the traditional sense—since USREC data is backward-looking and the current month always remains non-recessionary until officially confirmed. Nonetheless, it can cause confusion, as users may see recession periods shaded retroactively only after the data becomes available. Therefore, the current month will always appear non-recessionary until the next data point is released, and historical recession periods may be adjusted after the fact.
开源脚本
秉承TradingView的精神,该脚本的作者将其开源,以便交易者可以查看和验证其功能。向作者致敬!您可以免费使用该脚本,但请记住,重新发布代码须遵守我们的网站规则。
免责声明
这些信息和出版物并非旨在提供,也不构成TradingView提供或认可的任何形式的财务、投资、交易或其他类型的建议或推荐。请阅读使用条款了解更多信息。
开源脚本
秉承TradingView的精神,该脚本的作者将其开源,以便交易者可以查看和验证其功能。向作者致敬!您可以免费使用该脚本,但请记住,重新发布代码须遵守我们的网站规则。
免责声明
这些信息和出版物并非旨在提供,也不构成TradingView提供或认可的任何形式的财务、投资、交易或其他类型的建议或推荐。请阅读使用条款了解更多信息。