OPEN-SOURCE SCRIPT
已更新 Dynamic Highest Lowest Moving Average
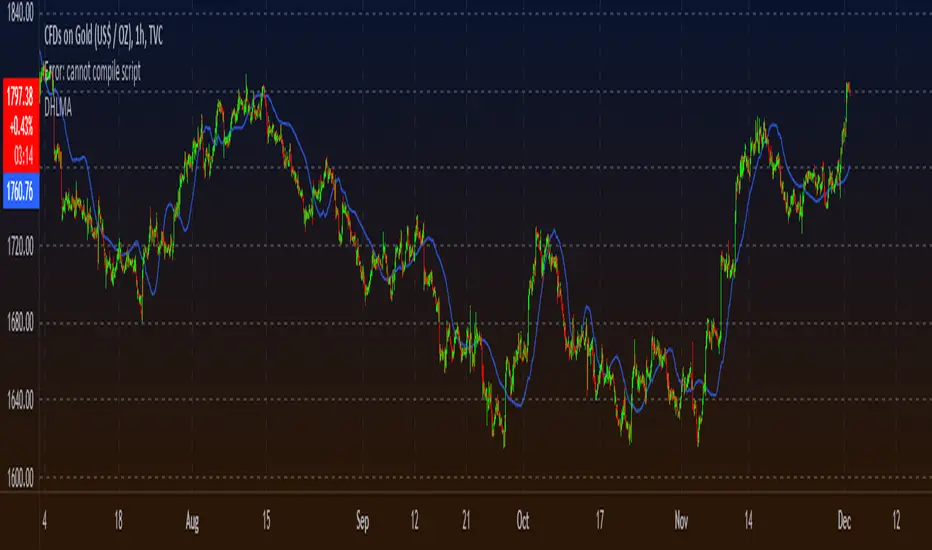
Similar to my last script, although this one uses the RSI value of
(highest high - price) / (price - lowest low)
to feed into the the logic creating the dynamic length. Choose how the length curve works by selecting either Incline, Decline, Peak or Trough.
Lastly select the moving average type to filter the result through to smoothen things out a bit
to find something that works for your strategy. This is useful as an entry/exit indicator along with other moving averages, or even just a standalone if you play with the settings enough.
版本注释
Overlay = True版本注释
Cleaned up, fix chart image版本注释
Added more thorough explanation of how we arrive at the average. Added ability to change the coeficcient, in how different each step up/down will be
Added option to include the current, or former price in the averaging of the highest/lowest values
开源脚本
秉承TradingView的精神,该脚本的作者将其开源,以便交易者可以查看和验证其功能。向作者致敬!您可以免费使用该脚本,但请记住,重新发布代码须遵守我们的网站规则。
免责声明
这些信息和出版物并非旨在提供,也不构成TradingView提供或认可的任何形式的财务、投资、交易或其他类型的建议或推荐。请阅读使用条款了解更多信息。
开源脚本
秉承TradingView的精神,该脚本的作者将其开源,以便交易者可以查看和验证其功能。向作者致敬!您可以免费使用该脚本,但请记住,重新发布代码须遵守我们的网站规则。
免责声明
这些信息和出版物并非旨在提供,也不构成TradingView提供或认可的任何形式的财务、投资、交易或其他类型的建议或推荐。请阅读使用条款了解更多信息。