OPEN-SOURCE SCRIPT
已更新 GANN Level (Salil Sir)
GANN Level Indicator Description
This Pine Script calculates and plots Gann Levels based on a user-defined price input. It creates horizontal lines at key support and resistance levels derived from the input price, applying Gann's theory of market structure. The levels are dynamically calculated and squared for enhanced precision.
Key Features:
Manual Price Input:
The user inputs a round off of square root of base price (Manual_Input), which serves as the foundation for calculations.
Support and Resistance Levels:
Six resistance levels (R1 to R6) and six support levels (S1 to S6) are calculated by incrementing or decrementing the base price in steps of 0.25.
Squared Levels:
Each level is squared (level^2) to align with Gann's mathematical principles.
Visualization:
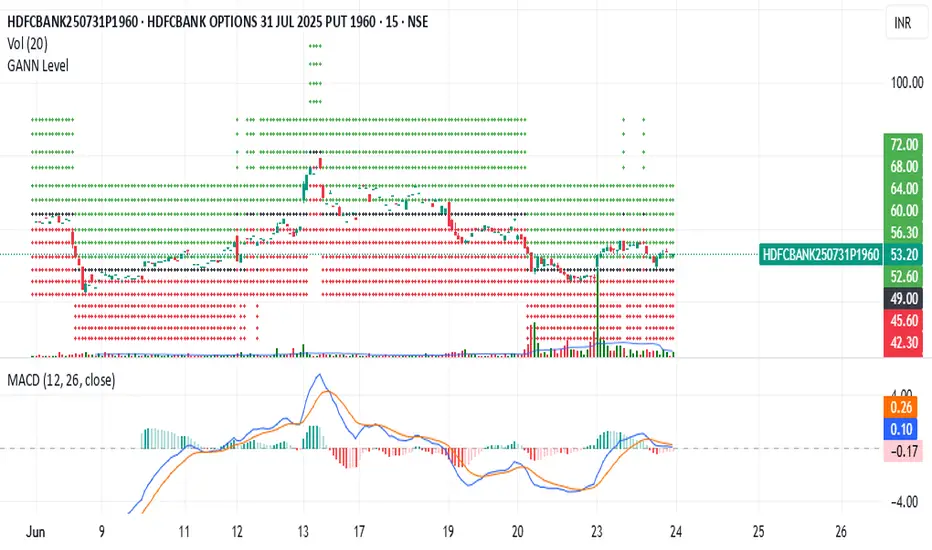
All levels, including the base price squared (GANN), are plotted as horizontal dotted lines:
Black Line: Base price squared (Gann Level).
Green Lines: Resistance levels.
Red Lines: Support levels.
Purpose:
The indicator helps traders identify potential support and resistance zones based on Gann's methodology, providing a mathematical framework for decision-making.
Usage:
Adjust the Manual Price in the settings to the desired value.
Observe the plotted levels for key support and resistance zones on the chart.
Use these levels to make informed trading decisions or to validate other indicators.
This Pine Script calculates and plots Gann Levels based on a user-defined price input. It creates horizontal lines at key support and resistance levels derived from the input price, applying Gann's theory of market structure. The levels are dynamically calculated and squared for enhanced precision.
Key Features:
Manual Price Input:
The user inputs a round off of square root of base price (Manual_Input), which serves as the foundation for calculations.
Support and Resistance Levels:
Six resistance levels (R1 to R6) and six support levels (S1 to S6) are calculated by incrementing or decrementing the base price in steps of 0.25.
Squared Levels:
Each level is squared (level^2) to align with Gann's mathematical principles.
Visualization:
All levels, including the base price squared (GANN), are plotted as horizontal dotted lines:
Black Line: Base price squared (Gann Level).
Green Lines: Resistance levels.
Red Lines: Support levels.
Purpose:
The indicator helps traders identify potential support and resistance zones based on Gann's methodology, providing a mathematical framework for decision-making.
Usage:
Adjust the Manual Price in the settings to the desired value.
Observe the plotted levels for key support and resistance zones on the chart.
Use these levels to make informed trading decisions or to validate other indicators.
版本注释
Dear GANN Level Users,We’re excited to announce an update to the GANN Level indicator! Now, there’s no need to manually input any values. Simply apply the indicator to any chart, and it will automatically calculate and plot GANN levels based on the square root of the opening price for the selected script.
These levels are dynamically updated and follow the price movement, ensuring real-time support and resistance zones. We hope this improvement enhances your trading experience and makes the tool even more convenient and enjoyable to use.
Happy trading! 🚀
版本注释
Bug Fixed版本注释
Bug Fixed开源脚本
秉承TradingView的精神,该脚本的作者将其开源,以便交易者可以查看和验证其功能。向作者致敬!您可以免费使用该脚本,但请记住,重新发布代码须遵守我们的网站规则。
免责声明
这些信息和出版物并非旨在提供,也不构成TradingView提供或认可的任何形式的财务、投资、交易或其他类型的建议或推荐。请阅读使用条款了解更多信息。
免责声明
这些信息和出版物并非旨在提供,也不构成TradingView提供或认可的任何形式的财务、投资、交易或其他类型的建议或推荐。请阅读使用条款了解更多信息。