INVITE-ONLY SCRIPT
Volatility Based Momentum by QTX Algo Systems
Volatility Based Momentum by QTX Algo Systems
Overview
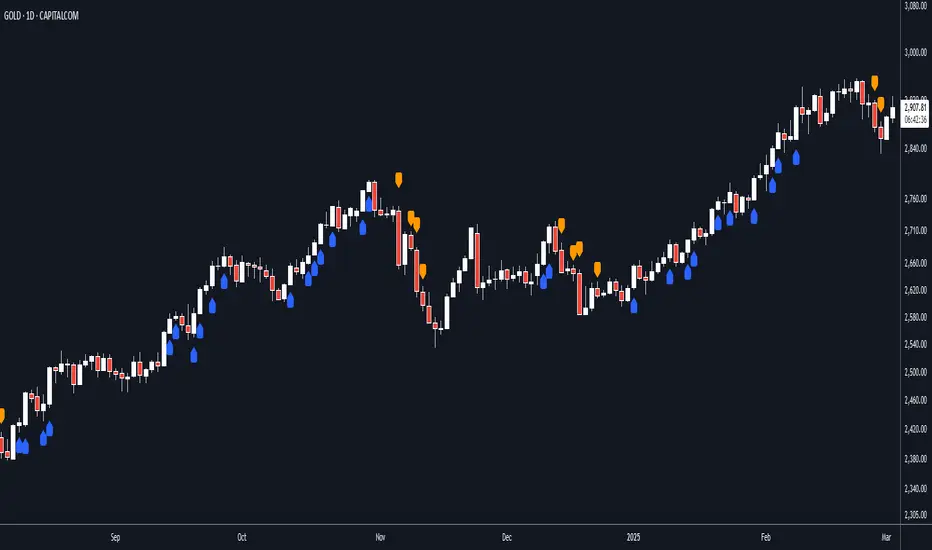
This indicator is designed to determine whether a market trend is genuinely supported by both momentum and volatility. It produces per-candle signals when a smoothed momentum oscillator is above its moving average, a Price – Moving Average Ratio confirms overall trend strength by remaining above a preset level with a positive slope, and when at least one of two distinct volatility metrics is rising. This integrated approach offers traders a consolidated and dynamic view of market energy, delivering more actionable insights than a simple merger of standard indicators.
How It Works
The indicator fuses two complementary volatility measures with dual momentum assessments to ensure robust signal generation. One volatility metric evaluates long-term market behavior by analyzing the dispersion of logarithmic price changes, while the other—derived from a Bollinger Band Width Percentile—captures recent price variability and confirms that market volatility remains above a minimum threshold. A trading signal is generated only when at least one of these volatility measures shows a sustained upward trend over several candles.
For momentum, a double‐smoothed Stochastic Momentum Index provides a refined, short-term view of price action, filtering out market noise. In addition, the PMARP serves as a confirmation tool by comparing the current price to its moving average, requiring that its value remains above a defined level with a positive slope to indicate a strong trend. Together, these elements ensure that a signal is only produced when both the market’s momentum and volatility are in alignment.
Although the components used are based on well-known technical analysis methods, the thoughtful integration of these elements creates a tool that is more than the sum of its parts. By combining long-term volatility assessment with a real-time measure of recent price variability—and by merging short-term momentum analysis with a confirmation of overall trend strength—the indicator delivers a more reliable and comprehensive view of market energy. This holistic approach distinguishes it from standard indicators.
How to Use
Traders can adjust the volatility threshold setting to tailor the indicator to their preferred market or timeframe. The indicator displays per-candle signals when both the refined momentum criteria and the dynamic volatility conditions are met. These signals are intended to be used as part of a broader trading strategy, in conjunction with other technical analysis tools for confirming entries and exits.
Disclaimer
This indicator is for educational purposes only and is intended to support your trading strategy. It does not guarantee performance, and past results are not indicative of future outcomes. Always use proper risk management and perform your own analysis before trading.
Overview
This indicator is designed to determine whether a market trend is genuinely supported by both momentum and volatility. It produces per-candle signals when a smoothed momentum oscillator is above its moving average, a Price – Moving Average Ratio confirms overall trend strength by remaining above a preset level with a positive slope, and when at least one of two distinct volatility metrics is rising. This integrated approach offers traders a consolidated and dynamic view of market energy, delivering more actionable insights than a simple merger of standard indicators.
How It Works
The indicator fuses two complementary volatility measures with dual momentum assessments to ensure robust signal generation. One volatility metric evaluates long-term market behavior by analyzing the dispersion of logarithmic price changes, while the other—derived from a Bollinger Band Width Percentile—captures recent price variability and confirms that market volatility remains above a minimum threshold. A trading signal is generated only when at least one of these volatility measures shows a sustained upward trend over several candles.
For momentum, a double‐smoothed Stochastic Momentum Index provides a refined, short-term view of price action, filtering out market noise. In addition, the PMARP serves as a confirmation tool by comparing the current price to its moving average, requiring that its value remains above a defined level with a positive slope to indicate a strong trend. Together, these elements ensure that a signal is only produced when both the market’s momentum and volatility are in alignment.
Although the components used are based on well-known technical analysis methods, the thoughtful integration of these elements creates a tool that is more than the sum of its parts. By combining long-term volatility assessment with a real-time measure of recent price variability—and by merging short-term momentum analysis with a confirmation of overall trend strength—the indicator delivers a more reliable and comprehensive view of market energy. This holistic approach distinguishes it from standard indicators.
How to Use
Traders can adjust the volatility threshold setting to tailor the indicator to their preferred market or timeframe. The indicator displays per-candle signals when both the refined momentum criteria and the dynamic volatility conditions are met. These signals are intended to be used as part of a broader trading strategy, in conjunction with other technical analysis tools for confirming entries and exits.
Disclaimer
This indicator is for educational purposes only and is intended to support your trading strategy. It does not guarantee performance, and past results are not indicative of future outcomes. Always use proper risk management and perform your own analysis before trading.
仅限邀请脚本
只有作者授权的用户才能访问此脚本。您需要申请并获得使用许可。通常情况下,付款后即可获得许可。更多详情,请按照下方作者的说明操作,或直接联系QTXAlgoSystems。
TradingView不建议您付费购买或使用任何脚本,除非您完全信任其作者并了解其工作原理。您也可以在我们的社区脚本找到免费的开源替代方案。
作者的说明
If you would like access to this indicator please contact QTX Algo Systems at contact@qtxalgosystems.com or visit qtxalgosystems.com
Contact us at contact@qtxalgosystems.com to access all of our tools and education or visit qtxalgosystems.com
免责声明
这些信息和出版物并非旨在提供,也不构成TradingView提供或认可的任何形式的财务、投资、交易或其他类型的建议或推荐。请阅读使用条款了解更多信息。