OPEN-SOURCE SCRIPT
已更新 RM Timeframe Continuity

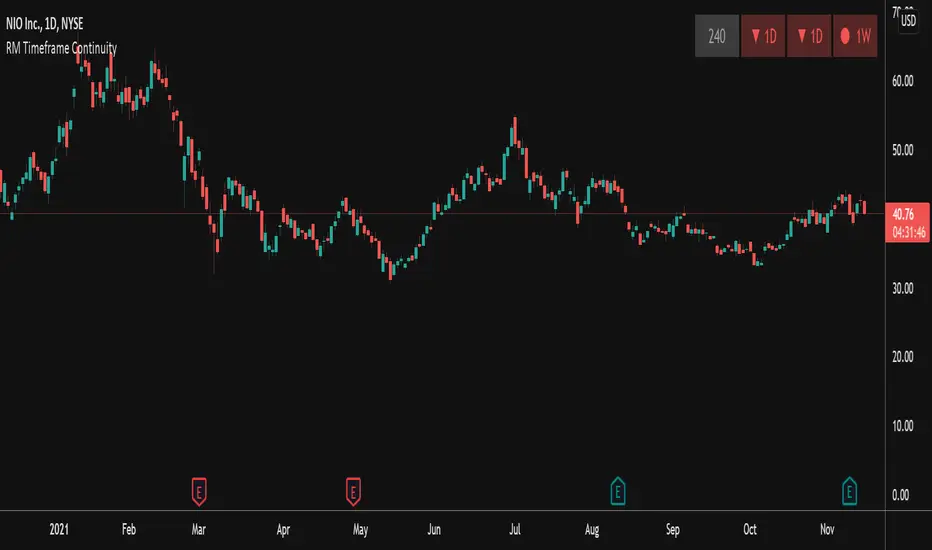
This indicator plots a table off to the right of the chart to help with determining timeframe continuity. Per the Strat, a great edge is only taking trades where full timeframe continuity is in place (i.e. if you are going long, make sure other timeframes are also green).
In this script:
User defined options:
In this script:
- Green candles have green colored boxes, red candles have red colored boxes.
- Inside bars are represented by a circle - ⬤
- Outside bars are represented by a tall rectangle - ▮
- 2-up bars are indicated by an up arrow - ▲
- 2-down bars are indicated by a down arrow - ▼
User defined options:
- Pick any timeframe for the 4 boxes
- Choose whether to plot the highs/lows of the larger timeframe candles as horizontal rays on your chart (along with the associated colors)
版本注释
Fixing a bug with the glyphs of the 4th box.开源脚本
秉承TradingView的精神,该脚本的作者将其开源,以便交易者可以查看和验证其功能。向作者致敬!您可以免费使用该脚本,但请记住,重新发布代码须遵守我们的网站规则。
免责声明
这些信息和出版物并非旨在提供,也不构成TradingView提供或认可的任何形式的财务、投资、交易或其他类型的建议或推荐。请阅读使用条款了解更多信息。
开源脚本
秉承TradingView的精神,该脚本的作者将其开源,以便交易者可以查看和验证其功能。向作者致敬!您可以免费使用该脚本,但请记住,重新发布代码须遵守我们的网站规则。
免责声明
这些信息和出版物并非旨在提供,也不构成TradingView提供或认可的任何形式的财务、投资、交易或其他类型的建议或推荐。请阅读使用条款了解更多信息。