OPEN-SOURCE SCRIPT
Diamond Grids @shrilss
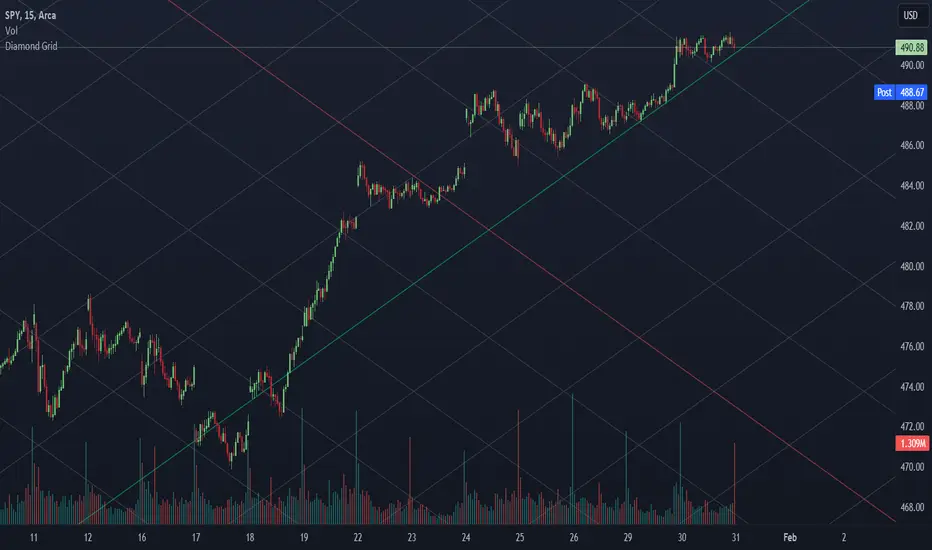
Uncover hidden patterns and potential reversal zones with the Diamond Grids Indicator. This script introduces a unique approach to visualizing price extremes within a specified range, aiding traders in identifying critical support and resistance levels. The indicator dynamically calculates and displays diamond-shaped grids based on user-defined short and long lengths and ATR. Utilize this powerful tool to enhance your technical analysis and gain insights into potential trend reversals.
Key Features:
- Dynamic Grid Calculation: The indicator dynamically calculates and plots diamond-shaped grids based on specified short and long lengths. These grids represent key price extremes within the defined range.
- Multi-Level Support and Resistance: Each diamond grid consists of multiple support and resistance lines, providing a comprehensive view of potential reversal zones. Traders can use these levels to make informed decisions.
- Customizable Parameters: Tailor the indicator to your trading style with customizable parameters such as short length, long length, and a multiplier. Adjust these settings to align the indicator with your unique preferences.
- Real-Time Updates: The indicator updates in real-time, ensuring that traders have the latest information on potential reversal zones. Stay ahead of market movements and make timely decisions.
- Toggle Trend Visualization: Diamond-shaped grids are color-coded for easy interpretation. Positive and negative grid lines are distinctly marked, offering a clear visual representation of the overall trend.
开源脚本
秉承TradingView的精神,该脚本的作者将其开源,以便交易者可以查看和验证其功能。向作者致敬!您可以免费使用该脚本,但请记住,重新发布代码须遵守我们的网站规则。
免责声明
这些信息和出版物并非旨在提供,也不构成TradingView提供或认可的任何形式的财务、投资、交易或其他类型的建议或推荐。请阅读使用条款了解更多信息。
免责声明
这些信息和出版物并非旨在提供,也不构成TradingView提供或认可的任何形式的财务、投资、交易或其他类型的建议或推荐。请阅读使用条款了解更多信息。