OPEN-SOURCE SCRIPT
Swing Levels
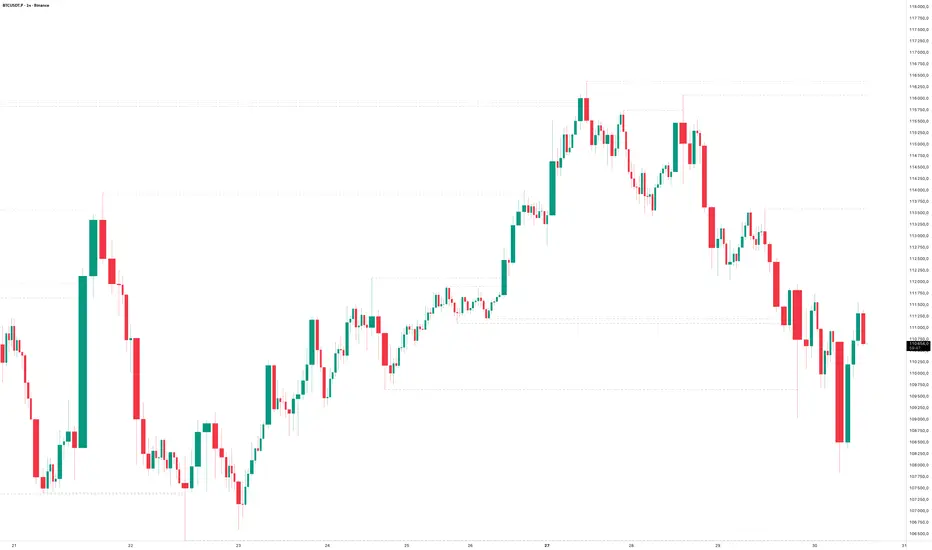
The Swing Levels indicator automatically detects and plots recent swing highs and lows on the chart, turning them into dynamic support and resistance levels.
Each new swing point creates a horizontal line that extends forward in time until price “fills” (touches or breaks) that level. Once a level is filled, it can either disappear or remain visible — depending on your settings.
You can enable alerts to be notified whenever price fills a swing high (breaks resistance) or a swing low (breaks support).
A lookback filter allows limiting how far back in history swing levels are drawn, helping keep the chart clean and efficient.
Main benefits:
• Automatically tracks key market structure turning points
• Helps visualize support and resistance zones in real time
• Optional alerts for breakout confirmations
• Fully customizable colors, line styles, and management behavior
• Works on any timeframe or market
In short:
Swing Levels gives you a clear and automated view of where price has recently reversed — powerful zones where liquidity and reactions often occur again.
Сreated with vibecoding using ChatGPT and Claude.
开源脚本
秉承TradingView的精神,该脚本的作者将其开源,以便交易者可以查看和验证其功能。向作者致敬!您可以免费使用该脚本,但请记住,重新发布代码须遵守我们的网站规则。
免责声明
这些信息和出版物并非旨在提供,也不构成TradingView提供或认可的任何形式的财务、投资、交易或其他类型的建议或推荐。请阅读使用条款了解更多信息。
免责声明
这些信息和出版物并非旨在提供,也不构成TradingView提供或认可的任何形式的财务、投资、交易或其他类型的建议或推荐。请阅读使用条款了解更多信息。