OPEN-SOURCE SCRIPT
Pivot Points High Low - JVersion
**Indicator Name**: Pivot Points High Low (Without Price Labels)
**Overview**
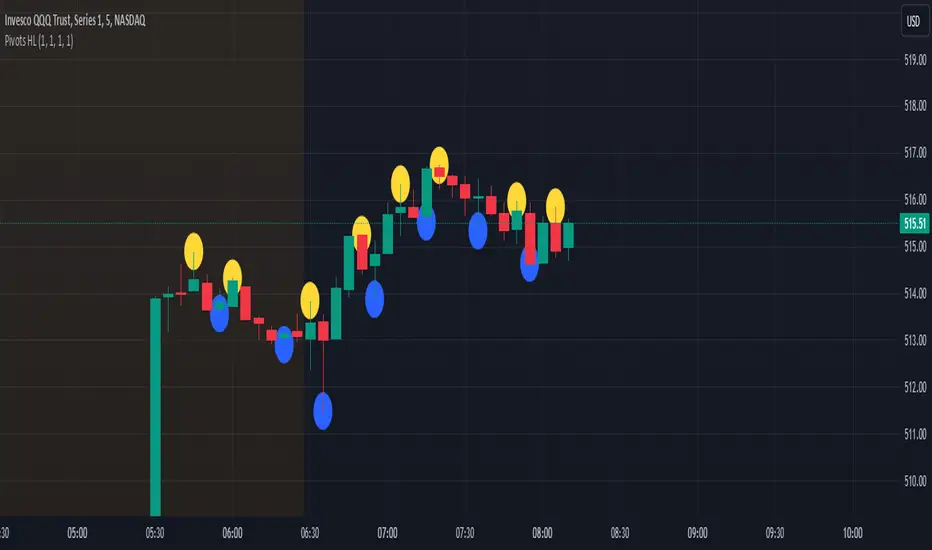
The Pivot Points High Low indicator is designed to identify and mark local highs and lows (or “pivot” points) on a price chart. Unlike other pivot-based indicators that label each pivot with its exact price, this version displays only small circular markers—removing clutter and focusing attention on the pivot locations themselves.
**Key Features**
1. **Pivot Detection**
- The script uses TradingView’s built-in `ta.pivothigh()` and `ta.pivotlow()` functions to determine when the market has formed a pivot high or pivot low.
- You can define how many bars to the left and right are required to confirm a pivot, helping you tailor the indicator to different market conditions and timeframes.
2. **Clean Markers**
- Each confirmed pivot high or low is represented by a circle placed precisely on the candle where the pivot is detected.
- No numeric labels are shown, keeping your chart visually uncluttered while still highlighting important turning points in price.
3. **Customization**
- **Left/Right Pivot Length**: Choose how many bars to the left and right must be lower (for highs) or higher (for lows) to validate a pivot. Larger values mean fewer but more significant pivots; smaller values mean more frequent pivots.
- **Marker Colors**: Independently customize the colors of the high-marker circles and low-marker circles to easily distinguish between local tops and bottoms.
4. **Usage and Interpretation**
- **Identifying Reversals**: As soon as a circle appears at a local high or low, it may indicate a short-term trend reversal or the beginning of a new swing in price.
- **Combine with Other Tools**: Pivot points are more informative when used alongside broader trend analysis, support/resistance identification, or other momentum indicators.
- **Adjusting Sensitivity**: By increasing or decreasing the left/right pivot lengths, you can make the indicator more or less sensitive to small market fluctuations.
5. **Practical Tips**
- **Swing Trading**: Shorter lengths can be used by swing traders looking for quick reversals in lower timeframes.
- **Longer-Term Trends**: Larger lengths are better for position traders or those who prefer to see only major turning points in the market.
- **Clean Chart Layout**: Because text labels are removed, you can visually focus on the circles—especially helpful if you use multiple indicators and prefer a less cluttered chart.
---
By pinpointing local highs and lows without price labels, the **Pivot Points High Low** indicator keeps charts neat yet informative, allowing traders to quickly recognize potential turning points in the market and make more informed decisions.
**Overview**
The Pivot Points High Low indicator is designed to identify and mark local highs and lows (or “pivot” points) on a price chart. Unlike other pivot-based indicators that label each pivot with its exact price, this version displays only small circular markers—removing clutter and focusing attention on the pivot locations themselves.
**Key Features**
1. **Pivot Detection**
- The script uses TradingView’s built-in `ta.pivothigh()` and `ta.pivotlow()` functions to determine when the market has formed a pivot high or pivot low.
- You can define how many bars to the left and right are required to confirm a pivot, helping you tailor the indicator to different market conditions and timeframes.
2. **Clean Markers**
- Each confirmed pivot high or low is represented by a circle placed precisely on the candle where the pivot is detected.
- No numeric labels are shown, keeping your chart visually uncluttered while still highlighting important turning points in price.
3. **Customization**
- **Left/Right Pivot Length**: Choose how many bars to the left and right must be lower (for highs) or higher (for lows) to validate a pivot. Larger values mean fewer but more significant pivots; smaller values mean more frequent pivots.
- **Marker Colors**: Independently customize the colors of the high-marker circles and low-marker circles to easily distinguish between local tops and bottoms.
4. **Usage and Interpretation**
- **Identifying Reversals**: As soon as a circle appears at a local high or low, it may indicate a short-term trend reversal or the beginning of a new swing in price.
- **Combine with Other Tools**: Pivot points are more informative when used alongside broader trend analysis, support/resistance identification, or other momentum indicators.
- **Adjusting Sensitivity**: By increasing or decreasing the left/right pivot lengths, you can make the indicator more or less sensitive to small market fluctuations.
5. **Practical Tips**
- **Swing Trading**: Shorter lengths can be used by swing traders looking for quick reversals in lower timeframes.
- **Longer-Term Trends**: Larger lengths are better for position traders or those who prefer to see only major turning points in the market.
- **Clean Chart Layout**: Because text labels are removed, you can visually focus on the circles—especially helpful if you use multiple indicators and prefer a less cluttered chart.
---
By pinpointing local highs and lows without price labels, the **Pivot Points High Low** indicator keeps charts neat yet informative, allowing traders to quickly recognize potential turning points in the market and make more informed decisions.
开源脚本
秉承TradingView的精神,该脚本的作者将其开源,以便交易者可以查看和验证其功能。向作者致敬!您可以免费使用该脚本,但请记住,重新发布代码须遵守我们的网站规则。
免责声明
这些信息和出版物并非旨在提供,也不构成TradingView提供或认可的任何形式的财务、投资、交易或其他类型的建议或推荐。请阅读使用条款了解更多信息。
免责声明
这些信息和出版物并非旨在提供,也不构成TradingView提供或认可的任何形式的财务、投资、交易或其他类型的建议或推荐。请阅读使用条款了解更多信息。