OPEN-SOURCE SCRIPT
已更新 MTF Damiani Volatmeter v3.2
Damiani_volatmeter.mq4 v3.2 |
Copyright © 2006,2007 Luis Guilherme Damiani |
It is a transplant of an indicator to judge the range market price.
The original is judged by the two curves, but this indicator shows the difference between the two curves.
If it is 0 or less, it can be judged as a range.
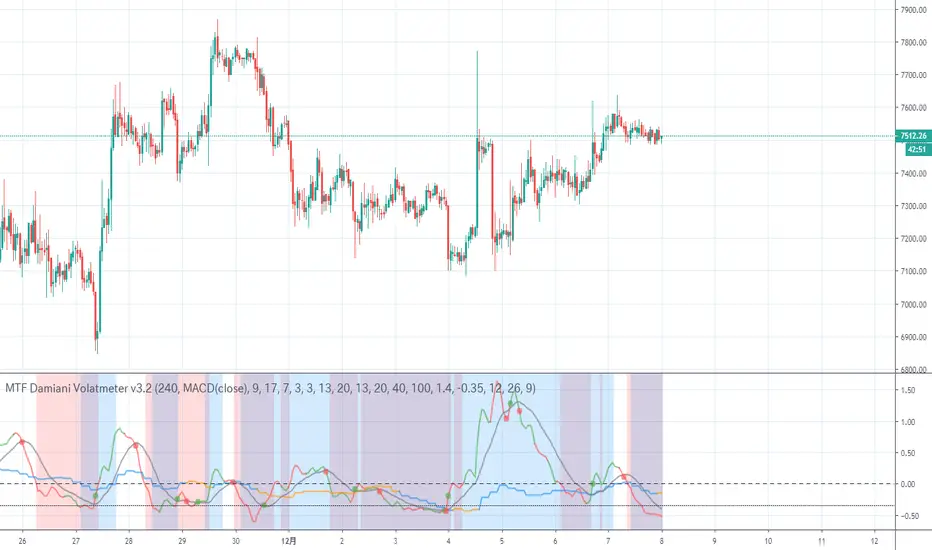
The red and green lines show the strength of this hourly trend, and if the range is below zero, the background is painted red.
The blue and orange lines indicate the strength of the trend of the upper leg, and if the market price is below zero, the background is painted blue.
I think that the background color will be purple if the market price is both strong and below zero.
レンジ相場を判定するインジケーターを移植したものです。
本来のものは2本の曲線で判断するのですが、このインジケーターでは2本の曲線の差を表示しています。
0以下ならレンジと判定できます。
赤と緑の線はこの時間足のトレンドの強さを示し、ゼロ以下のレンジ相場なら、背景を赤く塗っています。
青とオレンジ色の線は上位足のトレンドの強さを示し、ゼロ以下のレンジ相場なら、背景を青く塗っています。
両方ゼロ以下の強いレンジ相場なら背景色が紫色のなると思います。
Copyright © 2006,2007 Luis Guilherme Damiani |
It is a transplant of an indicator to judge the range market price.
The original is judged by the two curves, but this indicator shows the difference between the two curves.
If it is 0 or less, it can be judged as a range.
The red and green lines show the strength of this hourly trend, and if the range is below zero, the background is painted red.
The blue and orange lines indicate the strength of the trend of the upper leg, and if the market price is below zero, the background is painted blue.
I think that the background color will be purple if the market price is both strong and below zero.
レンジ相場を判定するインジケーターを移植したものです。
本来のものは2本の曲線で判断するのですが、このインジケーターでは2本の曲線の差を表示しています。
0以下ならレンジと判定できます。
赤と緑の線はこの時間足のトレンドの強さを示し、ゼロ以下のレンジ相場なら、背景を赤く塗っています。
青とオレンジ色の線は上位足のトレンドの強さを示し、ゼロ以下のレンジ相場なら、背景を青く塗っています。
両方ゼロ以下の強いレンジ相場なら背景色が紫色のなると思います。
版本注释
Changed the color painting method to trend. DV Color use trend color The previous MACD painting can be done with the option.Green and blue mean uptrend and red and orange mean downtrend.
It is expected that there is a lot of hesitation because a considerable reaction speed was necessary for practical use.
The usage is assumed to be LONG for green and SHORT for red when Damani Volatmeter exceeds 0.
色の塗り方をトレンドに変更。DV Color use trend color オプションで前のMACD塗り分けにできます。
緑、青が上昇トレンド、赤、オレンジが下降トレンド意味します。
実用上かなりの反応速度が必要だったので騙しが多いと予想されます。
使い方は、Damiani Volatmeterが0を超えた時に、緑ならLONG、赤ならSHORTと想定しています
版本注释
Added MACD (close) to DV color (change to default color)Added signal line to check DV turning point
DVの色塗りにMACD(close)を追加(デフォルト色塗りに変更)
DVの転換点を調べる用にシグナルラインを追加
版本注释
Fine adjustment of singnal linesingnal lineを微調整
版本注释
Added option settings in detailオプションの設定を細かくできるようにしました
If DV is less than 0, it is premised on the range price.
It seems that you can use the signal line to understand the trend.
The trend is generated in the boxed area, so we recommend the trend. It's even better if you can wait until DV exceeds 0, but you might be able to fly.
The problem is how to determine the direction of the trend. Currently, it is good to use price action. As an indicator, the direction of MACD is displayed.
The part that is not enclosed by the square is the part where the trend is decreasing.
DVが0以下の場合はレンジ相場という前提です。
シグナルラインを使って、さらにトレンド発生を把握でき用できるようです。
四角で囲んだ部分がトレンド発生しているので、順張りトレンド推奨です。DVが0を超えるまで待てるとさらに良いのですが、フライングできるかもしれないです。
問題はトレンドの方向をどうやって判断するかです。現状はプライスアクションを使用するのが良さげです。インジケーターとしてはMACDの方向を表示しています。
四角で囲んでい居ない部分はトレンドが減っている部分なので、トレ―どしないか、0以下になってから逆張りが良いと思われます。
版本注释
The update was not successful, so re-update更新が上手くいってなかったので、再更新
版本注释
Organize optionsAdd MACD OS, donchian to color coating
オプション整理
色塗りにMACD OS,donchian追加
版本注释
add alertアラート機能追加
开源脚本
秉承TradingView的精神,该脚本的作者将其开源,以便交易者可以查看和验证其功能。向作者致敬!您可以免费使用该脚本,但请记住,重新发布代码须遵守我们的网站规则。
免责声明
这些信息和出版物并非旨在提供,也不构成TradingView提供或认可的任何形式的财务、投资、交易或其他类型的建议或推荐。请阅读使用条款了解更多信息。
免责声明
这些信息和出版物并非旨在提供,也不构成TradingView提供或认可的任何形式的财务、投资、交易或其他类型的建议或推荐。请阅读使用条款了解更多信息。