OPEN-SOURCE SCRIPT
已更新 YCGH Drawdown Percentiles
What This Indicator Does?
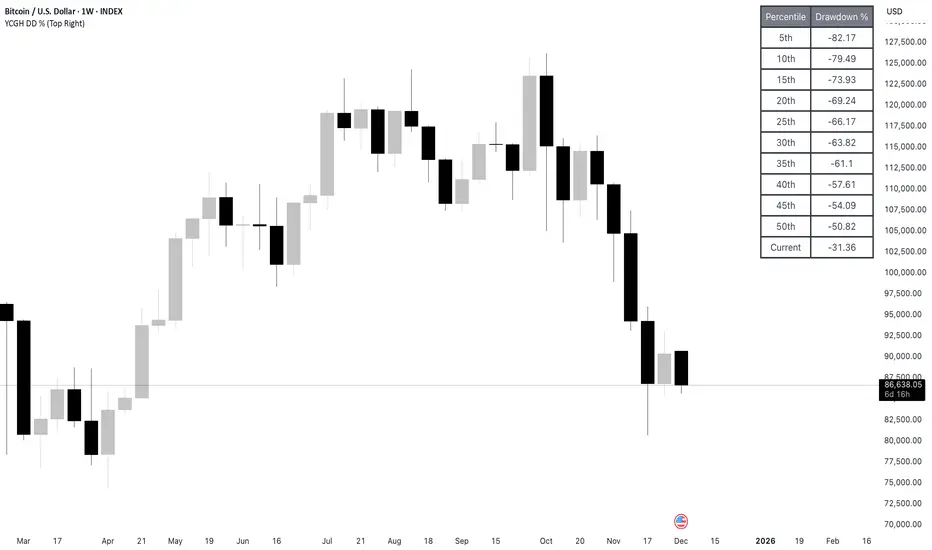
The Drawdown Percentiles indicator tracks how far below the all-time high (ATH) a stock or asset is currently trading, then displays statistical percentiles of historical drawdowns in a customizable table.
Percentile Analysis: It collects up to 5,000 historical bars of drawdown data, sorts them, and calculates user-selected percentiles (default: 10th, 30th, 50th) to show where current drawdowns rank historically.
Visual Display: A table shows each percentile threshold with color-coded drawdown values, helping you quickly assess whether the current drawdown is typical or extreme compared to historical patterns.
Practical Use Cases
Risk Assessment: Identify if current drawdowns fall within normal ranges or represent extreme conditions requiring position adjustments.
Entry/Exit Timing: Use percentile rankings to time entries during historically shallow drawdowns (better conditions) and reduce exposure during deep drawdowns.
Strategy Comparison: Compare drawdown patterns across different assets or trading strategies to evaluate risk-adjusted performance.
版本注释
updated table版本注释
logic updated版本注释
updated Table版本注释
removed lines版本注释
table made fancy版本注释
Summary of Functional Changes:Fixed 10 percentiles instead of 3 customizable ones
Complete percentile calculation logic that actually works
Full table border on all sides (frame)
Individual color customization for each percentile level
Current drawdown display as the last row
Visual ATH reference on the chart
Proper data storage in array for historical analysis
开源脚本
秉承TradingView的精神,该脚本的作者将其开源,以便交易者可以查看和验证其功能。向作者致敬!您可以免费使用该脚本,但请记住,重新发布代码须遵守我们的网站规则。
YCGH Capital
免责声明
这些信息和出版物并非旨在提供,也不构成TradingView提供或认可的任何形式的财务、投资、交易或其他类型的建议或推荐。请阅读使用条款了解更多信息。
开源脚本
秉承TradingView的精神,该脚本的作者将其开源,以便交易者可以查看和验证其功能。向作者致敬!您可以免费使用该脚本,但请记住,重新发布代码须遵守我们的网站规则。
YCGH Capital
免责声明
这些信息和出版物并非旨在提供,也不构成TradingView提供或认可的任何形式的财务、投资、交易或其他类型的建议或推荐。请阅读使用条款了解更多信息。