PROTECTED SOURCE SCRIPT
OBV Oscillator [CP]
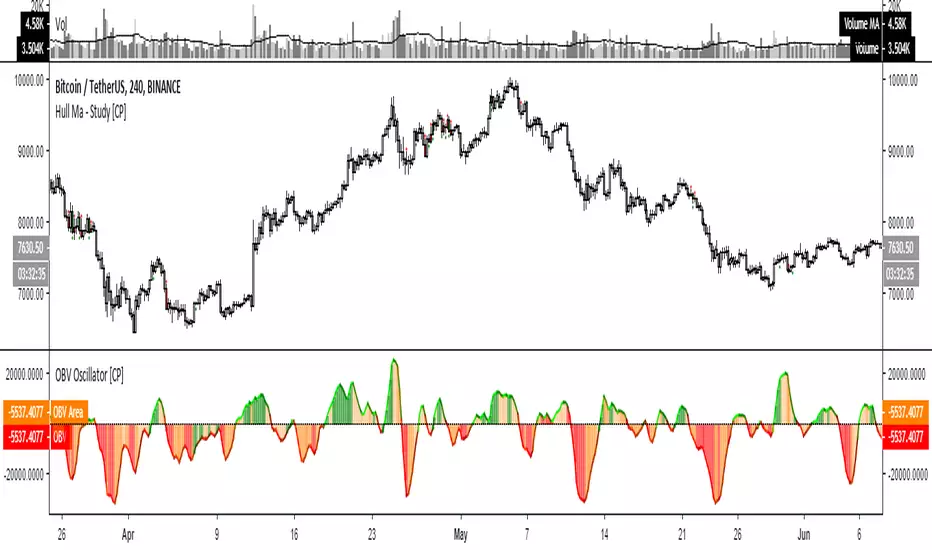
This is my version of the OBV Oscillator and I've used CCI to color the histogram
Line colors:
* Lime rising line above 0 line: Strong Bullish
* Green falling line above 0 line : Neutral Bullish
* Red falling line below 0 line : Strong Bearish
* Maroon rising line below 0 line : Neutral Bearish
Histogram colors:
*Green background above 0 line: Strong Bullish / Overbought
*Orange background above 0 line: Neutral Bullish
*Red background below 0 line: Strong Bearish / Oversold
*Orange background below 0 line: Neutral Bearish
受保护脚本
此脚本以闭源形式发布。 但是,您可以自由使用,没有任何限制 — 了解更多信息这里。
免责声明
这些信息和出版物并非旨在提供,也不构成TradingView提供或认可的任何形式的财务、投资、交易或其他类型的建议或推荐。请阅读使用条款了解更多信息。
受保护脚本
此脚本以闭源形式发布。 但是,您可以自由使用,没有任何限制 — 了解更多信息这里。
免责声明
这些信息和出版物并非旨在提供,也不构成TradingView提供或认可的任何形式的财务、投资、交易或其他类型的建议或推荐。请阅读使用条款了解更多信息。