PROTECTED SOURCE SCRIPT
已更新 Ultimate Average 3.0
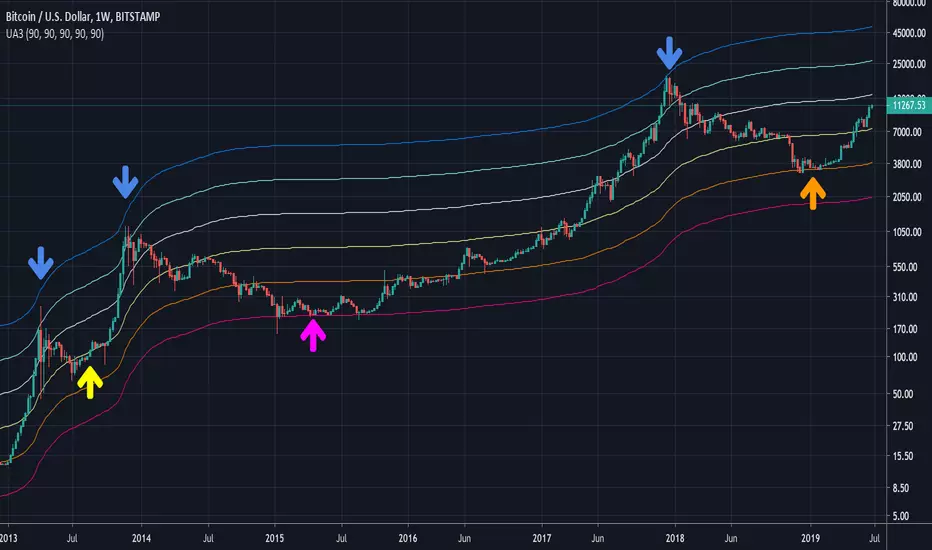
Purple = Actual average price over total timeframe.
Other lines are factors above the actual average.
A pattern emerges where the purple is hit, then a parabolic rise to the blue top, then the a drawback down to the orange, then parabolic, then drawback to yellow, then parabolic to blue, then a reset back to the purple line.
Other lines are factors above the actual average.
A pattern emerges where the purple is hit, then a parabolic rise to the blue top, then the a drawback down to the orange, then parabolic, then drawback to yellow, then parabolic to blue, then a reset back to the purple line.
版本注释
updates timescale automation受保护脚本
此脚本以闭源形式发布。 但是,您可以自由使用,没有任何限制 — 了解更多信息这里。
免责声明
这些信息和出版物并非旨在提供,也不构成TradingView提供或认可的任何形式的财务、投资、交易或其他类型的建议或推荐。请阅读使用条款了解更多信息。
受保护脚本
此脚本以闭源形式发布。 但是,您可以自由使用,没有任何限制 — 了解更多信息这里。
免责声明
这些信息和出版物并非旨在提供,也不构成TradingView提供或认可的任何形式的财务、投资、交易或其他类型的建议或推荐。请阅读使用条款了解更多信息。