OPEN-SOURCE SCRIPT
Ultra Strength Index

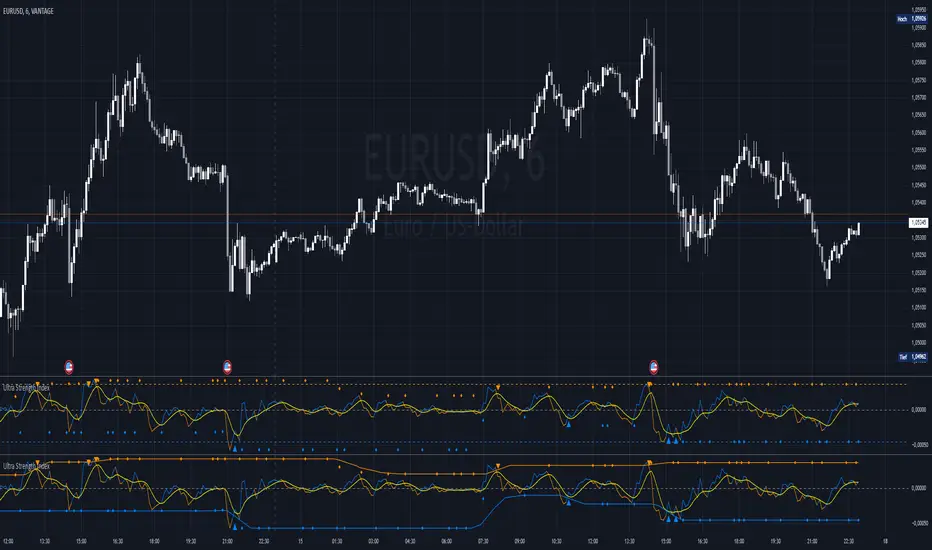
The Ultra Strength Index is a momentum-based indicator designed to enhance price action analysis. It identifies overbought/oversold levels and generates buy/sell signals based on momentum shifts. With customizable smoothing and dynamic updates, it suits both trend-following and reversal strategies.
Introduction
The Ultra Strength Index is a powerful tool designed to help traders analyze price momentum, identify trends, and recognize potential turning points in the market. By combining advanced smoothing techniques and customizable settings, it provides a clear visual representation of overbought/oversold conditions and momentum signals, making it suitable for all trading styles.
Detailed Description
The Ultra Strength Index works by analyzing price momentum and visualizing it through smoothed calculations.
Here's how it works:
.........
.........
Customizable colors, smoothing periods, and signal settings allow traders to tailor the indicator to their strategy.
Special Thanks
I use the TWMA-Function created from RedKTrader to smooth the values.
Special thanks to him/her for creating and sharing this function!
Introduction
The Ultra Strength Index is a powerful tool designed to help traders analyze price momentum, identify trends, and recognize potential turning points in the market. By combining advanced smoothing techniques and customizable settings, it provides a clear visual representation of overbought/oversold conditions and momentum signals, making it suitable for all trading styles.
Detailed Description
The Ultra Strength Index works by analyzing price momentum and visualizing it through smoothed calculations.
Here's how it works:
.........
- Impulse Line
Tracks changes in price momentum using a simple moving average (SMA) of the price change. This line reflects the strength and direction of momentum.
..... - Signal Line
A more stable, smoother version of the impulse line, calculated using a Triple Weigthend Moving Average (TWMA) wich created RedKTrader. It acts as a baseline to compare momentum shifts.
..... - Overbought/Oversold Zones
The indicator detects extreme price conditions using historical momentum levels. These levels are dynamically smoothed over a customizable lookback period to minimize noise and ensure reliability.
..... - Repainting Feature
The "Enable Repaint" option offers real-time updating of overbought/oversold levels for more reactive signals, while disabling it provides the actual level for retrospective analysis.
..... - Buy and Sell Signals
The impulse line crosses into or out of overbought/oversold zones. (Triangle)
The impulse line crosses above or below the signal line, indicating potential momentum shifts. (Diamond)
.........
Customizable colors, smoothing periods, and signal settings allow traders to tailor the indicator to their strategy.
Special Thanks
I use the TWMA-Function created from RedKTrader to smooth the values.
Special thanks to him/her for creating and sharing this function!
开源脚本
秉承TradingView的精神,该脚本的作者将其开源,以便交易者可以查看和验证其功能。向作者致敬!您可以免费使用该脚本,但请记住,重新发布代码须遵守我们的网站规则。
免责声明
这些信息和出版物并非旨在提供,也不构成TradingView提供或认可的任何形式的财务、投资、交易或其他类型的建议或推荐。请阅读使用条款了解更多信息。
开源脚本
秉承TradingView的精神,该脚本的作者将其开源,以便交易者可以查看和验证其功能。向作者致敬!您可以免费使用该脚本,但请记住,重新发布代码须遵守我们的网站规则。
免责声明
这些信息和出版物并非旨在提供,也不构成TradingView提供或认可的任何形式的财务、投资、交易或其他类型的建议或推荐。请阅读使用条款了解更多信息。