OPEN-SOURCE SCRIPT
已更新 HTF Overlay Candles (Aggregated)
🕯️ Synthetic Aggregated Candles
Created by: The_Forex_Steward
License: Mozilla Public License 2.0
🔍 Description
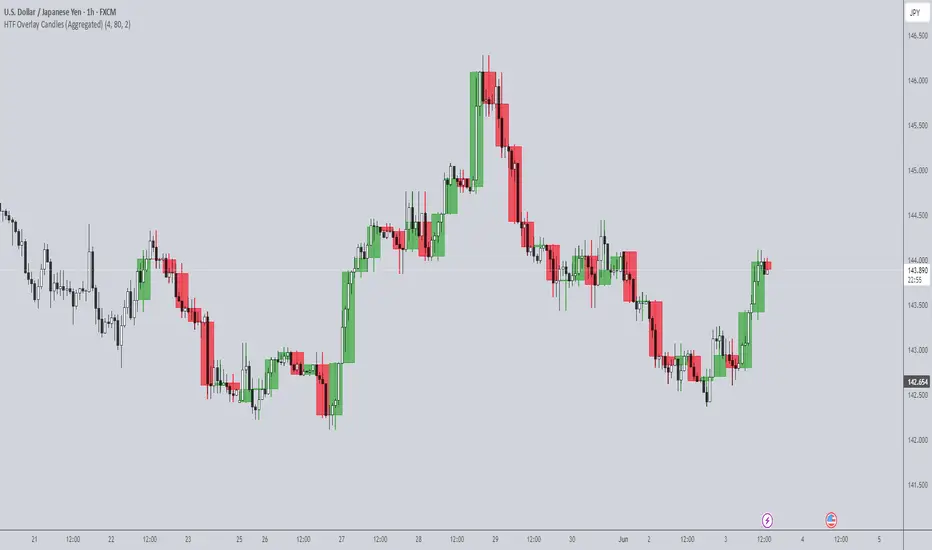
This indicator creates visually aggregated candles directly on your chart, allowing you to view synthetic candlesticks that combine multiple bars into one. It enables a higher-level perspective of price action without switching timeframes.
Each synthetic candle is built by combining a user-defined number of consecutive bars (e.g., 4 bars from the current timeframe form one aggregated candle). It accurately tracks open, high, low, and close values, then draws a colored box and wick to represent the aggregated data.
⚙️ Features
📌 Use Case
Ideal for traders looking to:
- Reduce noise in lower timeframes
- Visualize price action in broader chunks
- Spot larger structure and swing patterns without switching charts
📈 How It Works
At every bar, the script checks whether a new aggregation interval has begun (aligned to the day start). If so, it finalizes the previous candle and starts a new one. On the last bar of the chart, it ensures the final synthetic candle is drawn.
✅ Tip
For best results, apply this script on intraday timeframes and experiment with different aggregation factors (4, 6, 12, etc.) to discover the most insightful compression for your strategy.
Note: This script is optimized for visual representation only. It does not repaint, but it is not intended for algorithmic strategies or alerts.
Created by: The_Forex_Steward
License: Mozilla Public License 2.0
🔍 Description
This indicator creates visually aggregated candles directly on your chart, allowing you to view synthetic candlesticks that combine multiple bars into one. It enables a higher-level perspective of price action without switching timeframes.
Each synthetic candle is built by combining a user-defined number of consecutive bars (e.g., 4 bars from the current timeframe form one aggregated candle). It accurately tracks open, high, low, and close values, then draws a colored box and wick to represent the aggregated data.
⚙️ Features
- Aggregation Factor: Combine candles over a custom number of bars (e.g., 4 = 4x current TF)
- Timezone Alignment: Aggregation is aligned with midnight in UTC-5 (modifiable in code)
- Custom Colors: Choose colors for bullish and bearish synthetic candles
- Body Opacity: Control the opacity of the candle body for visual clarity
- Wick Width: Customize the thickness of the candle wick
📌 Use Case
Ideal for traders looking to:
- Reduce noise in lower timeframes
- Visualize price action in broader chunks
- Spot larger structure and swing patterns without switching charts
📈 How It Works
At every bar, the script checks whether a new aggregation interval has begun (aligned to the day start). If so, it finalizes the previous candle and starts a new one. On the last bar of the chart, it ensures the final synthetic candle is drawn.
✅ Tip
For best results, apply this script on intraday timeframes and experiment with different aggregation factors (4, 6, 12, etc.) to discover the most insightful compression for your strategy.
Note: This script is optimized for visual representation only. It does not repaint, but it is not intended for algorithmic strategies or alerts.
版本注释
agg close logic updated开源脚本
秉承TradingView的精神,该脚本的作者将其开源,以便交易者可以查看和验证其功能。向作者致敬!您可以免费使用该脚本,但请记住,重新发布代码须遵守我们的网站规则。
免责声明
这些信息和出版物并非旨在提供,也不构成TradingView提供或认可的任何形式的财务、投资、交易或其他类型的建议或推荐。请阅读使用条款了解更多信息。
开源脚本
秉承TradingView的精神,该脚本的作者将其开源,以便交易者可以查看和验证其功能。向作者致敬!您可以免费使用该脚本,但请记住,重新发布代码须遵守我们的网站规则。
免责声明
这些信息和出版物并非旨在提供,也不构成TradingView提供或认可的任何形式的财务、投资、交易或其他类型的建议或推荐。请阅读使用条款了解更多信息。