PROTECTED SOURCE SCRIPT
Aibuyzone Trade Signals (Free 5m & 1h Edition)
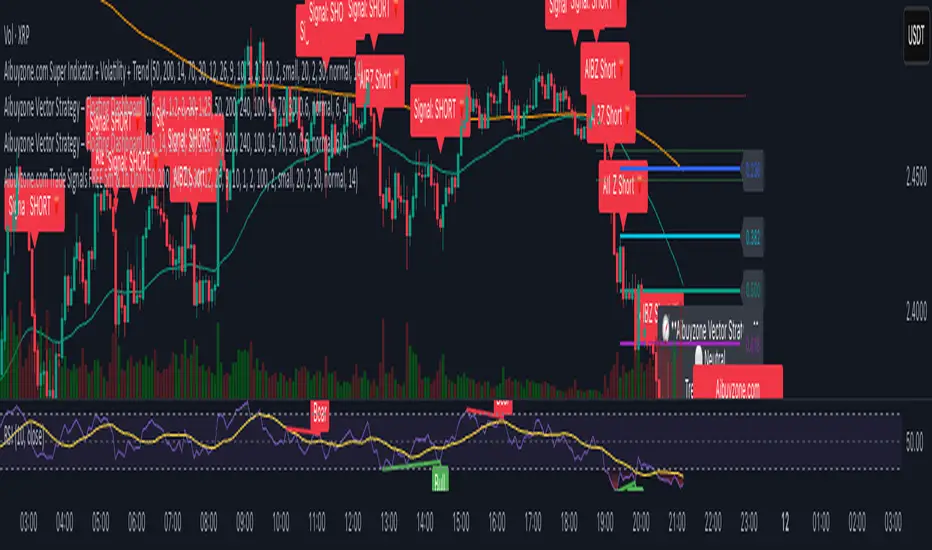
A complete trade-signal framework that blends EMA trend structure, RSI and MACD momentum filters, and volatility analysis with dynamic risk-reward visualization.
Includes automatic Fibonacci levels and a floating dashboard for quick insight into trend bias, signal direction, and volatility.
Works only on the 5-minute and 1-hour timeframes for demonstration and educational purposes.
🧩 Full Description (Main Script Page)
Overview
The Aibuyzone Trade Signals indicator is a structured trading framework designed to help traders understand how trend, momentum, and volatility interact.
It highlights potential long and short setups with clear on-chart feedback — combining technical filters with a dashboard display.
This free version operates exclusively on the 5-minute and 1-hour timeframes to demonstrate the signal system’s analytical approach.
Core Logic
Trend Filter (EMA Fast vs Slow):
Uses two EMAs to identify the dominant trend direction. A bullish trend is confirmed when the fast EMA is above the slow EMA, and vice versa for bearish.
Momentum Confirmation (RSI + MACD):
RSI confirms that price momentum supports the current trend, avoiding overextended zones.
MACD crossovers provide secondary confirmation to strengthen trend alignment.
Signal Generation:
Long Setup: When trend and momentum align bullishly, a “LONG 🚀” signal appears.
The script automatically calculates risk, stop-loss, and take-profit levels based on user-defined risk-to-reward ratios (TP1 and TP2).
Short Setup: Mirror logic for bearish setups, marked as “SHORT 🔻.”
Volatility Analysis (ATR-Based):
Calculates volatility as a percentage of price to classify market conditions as Low, Medium, or High.
This helps users understand if the current market environment is calm or volatile.
Auto-Fibonacci Framework:
Automatically plots Fibonacci retracement and extension levels from recent swing points to assist with target mapping and structure analysis.
Floating Dashboard:
Displays key information — trend state, current signal, entry/exit levels, and volatility — in real time.
The dashboard updates dynamically and keeps the chart clean and readable.
How to Use
Apply it only on the 5-minute or 1-hour timeframe (restricted by design).
Wait for a valid “LONG 🚀” or “SHORT 🔻” label before considering a setup.
Use the on-chart TP and SL levels for educational trade-planning practice.
Combine with your own technical or fundamental confluence tools for decision support.
The script is meant to teach structure, not to provide automated entries.
Educational Purpose
This indicator was created to demonstrate how multiple technical tools — moving averages, oscillators, volatility measures, and Fibonacci mapping — can be integrated to form a structured analysis framework.
It is not an automated trading system or financial-advice product.
Features
EMA, RSI, and MACD filters combined
Built-in TP1/TP2 and SL calculations
Auto-Fibonacci visualization
Volatility (ATR%) classification
Floating, real-time status dashboard
Customizable label sizes and colors
Clean and clear visual output
⚠️ Disclaimer
This script is for educational and analytical purposes only.
It does not guarantee profits or represent financial advice.
All trading carries risk, and users should conduct their own analysis before making any decisions.
受保护脚本
此脚本以闭源形式发布。 但是,您可以自由使用它,没有任何限制 — 在此处了解更多信息。
Signup for our Indicators Aibuyzone.com
免责声明
这些信息和出版物并不意味着也不构成TradingView提供或认可的金融、投资、交易或其它类型的建议或背书。请在使用条款阅读更多信息。
免责声明
这些信息和出版物并不意味着也不构成TradingView提供或认可的金融、投资、交易或其它类型的建议或背书。请在使用条款阅读更多信息。