OPEN-SOURCE SCRIPT
已更新 3 Weeks Tight - CANSLIM Technical Indicator
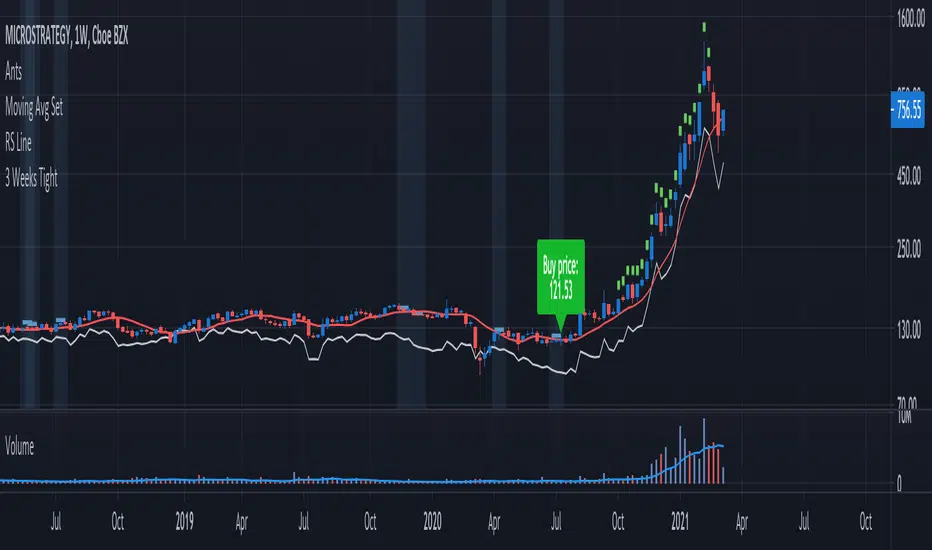
3 Weeks Tight - Introduction
3 weeks tight is a bullish continuation pattern discovered by IBD's founder, William O'Neil.
The pattern can used as an opportunity to add to an existing position as it often occurs after a breakout above a cup with handle or other technical pattern.
The 3 weeks tight pattern forms when a stock closes within approximately 1% to 1.5% of the prior week's close for at least two weeks. The reason for the bullishness is that it indciates that investors who moved the stock upward in price since the breakout are not taking profits, the price is holding steady.
The buy point is just above the area of resistance formed at the highs of the three weeks plus 10 cents. The ten cent addition to the price is to ensure a push through the resistance at the high of the range.

Key Points:
Features:
3 weeks tight is a bullish continuation pattern discovered by IBD's founder, William O'Neil.
The pattern can used as an opportunity to add to an existing position as it often occurs after a breakout above a cup with handle or other technical pattern.
The 3 weeks tight pattern forms when a stock closes within approximately 1% to 1.5% of the prior week's close for at least two weeks. The reason for the bullishness is that it indciates that investors who moved the stock upward in price since the breakout are not taking profits, the price is holding steady.
The buy point is just above the area of resistance formed at the highs of the three weeks plus 10 cents. The ten cent addition to the price is to ensure a push through the resistance at the high of the range.
Key Points:
- It's preferred that closes for each week are in the upper half of the stock's range.
- Ideally, volume will increase significantly as the stocks moves past the buy point.
- This pattern generally performs best when the market is in an uptrend.
Features:
- A configurable horizontal bar that spans the 3 week period.
- A vertical band that highlights the tightness pattern.
- A label to show the buy price after 3 week tight pattern.
- Optional alert when the 3 weeks tight pattern is recognized.
版本注释
version 2.0Updates:
■ The offset of the "Buy price" can be moved up/down.
■ The font size of the "Buy price" can be configured.
版本注释
version 3.0Updates:
■ Percent change calculations have been updated.
■ Settings dialog now groups together similar features.
开源脚本
本着TradingView的真正精神,此脚本的创建者将其开源,以便交易者可以查看和验证其功能。向作者致敬!虽然您可以免费使用它,但请记住,重新发布代码必须遵守我们的网站规则。
Access our premium tools: LevelUpTools.net
Join traders in over 40 countries and LevelUp!
Join traders in over 40 countries and LevelUp!
免责声明
这些信息和出版物并不意味着也不构成TradingView提供或认可的金融、投资、交易或其它类型的建议或背书。请在使用条款阅读更多信息。