OPEN-SOURCE SCRIPT
Price-EMA Z-Score Background
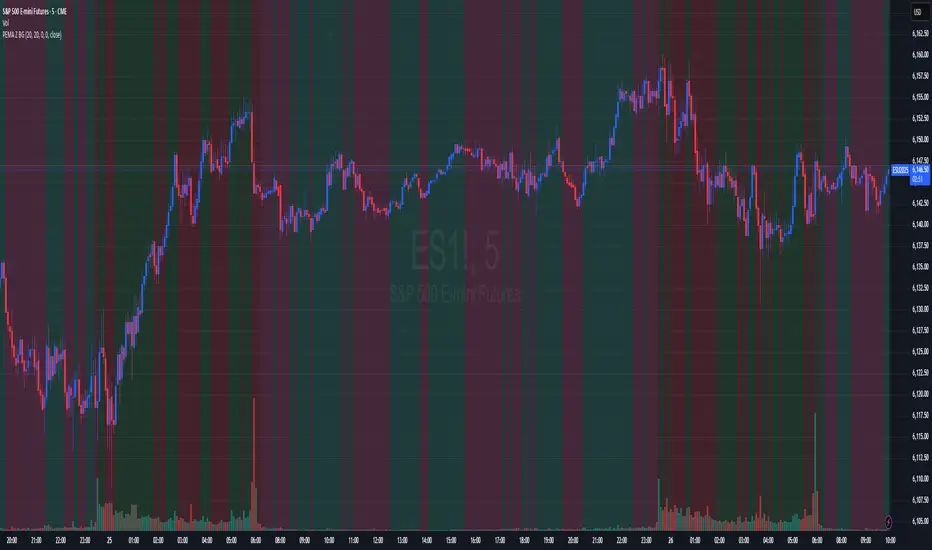
he “Price‑to‑EMA Z‑Score Background” indicator is designed to give you a clear, visual sense of when price has moved unusually far away from its smoothed trend, and to highlight those moments as potential overextension or mean‑reversion opportunities. Under the hood, it first computes a standard exponential moving average (EMA) of your chosen lookback length, then measures the raw difference between the current close and that EMA on every bar. To make that raw deviation comparable across different markets and timeframes, it converts the series of differences into a z‑score—subtracting the rolling mean of the deviations and dividing by their rolling standard deviation over a second lookback window.
Once you’ve normalized price‑to‑EMA distance into z‑score units, you can set two simple trigger levels: one upper threshold and one lower threshold. Whenever the z‑score climbs above the upper threshold, the chart background glows green, signaling that price is extended far above its EMA (and might be ripe for a pullback). Whenever the z‑score falls below the lower threshold, the background turns red, calling out an equally extreme move below the EMA (and a possible oversold bounce). Between those bands, no shading appears, letting you know price is trading within its “normal” range around the trend.
By adjusting the EMA period, the z‑score lookback, and the two trigger levels, you can dial in early warning signals (e.g. ±1 σ) or wait for very stretched moves (±2 σ or more). Used in concert with your favorite momentum or pattern tools—or even as a standalone visual cue—this simple background‑shading approach makes it easy to spot when a market is running too hot or too cold relative to its own recent average.
开源脚本
秉承TradingView的精神,该脚本的作者将其开源,以便交易者可以查看和验证其功能。向作者致敬!您可以免费使用该脚本,但请记住,重新发布代码须遵守我们的网站规则。
免责声明
这些信息和出版物并非旨在提供,也不构成TradingView提供或认可的任何形式的财务、投资、交易或其他类型的建议或推荐。请阅读使用条款了解更多信息。
开源脚本
秉承TradingView的精神,该脚本的作者将其开源,以便交易者可以查看和验证其功能。向作者致敬!您可以免费使用该脚本,但请记住,重新发布代码须遵守我们的网站规则。
免责声明
这些信息和出版物并非旨在提供,也不构成TradingView提供或认可的任何形式的财务、投资、交易或其他类型的建议或推荐。请阅读使用条款了解更多信息。