OPEN-SOURCE SCRIPT
已更新 Elliott Wave Analysis

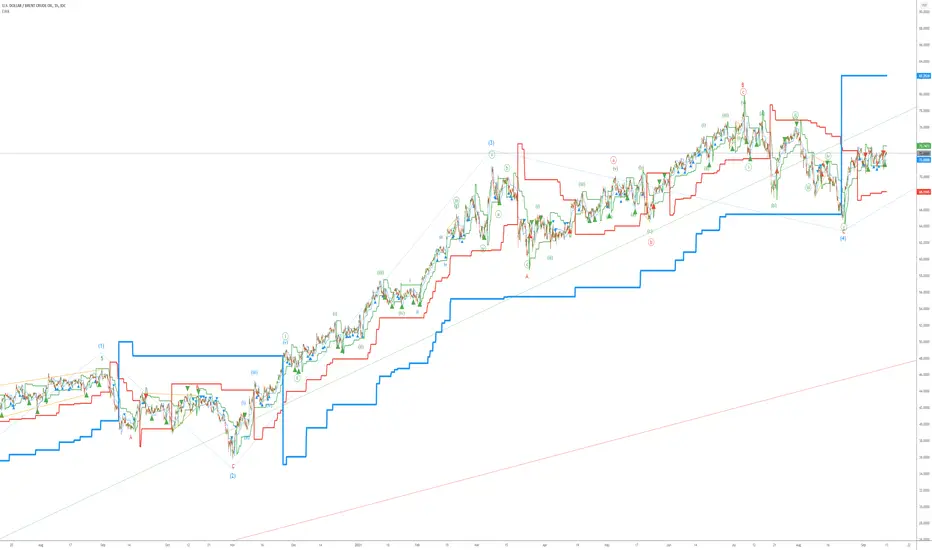
Initially, Elliott wave analysis is designed to simplify and increase the objectivity of graph analysis using the Elliott method. Probably, this indicator can be successfully used in trading without knowing the Elliott method.
The indicator is based on a supertrend. Supertrends are built in accordance with the Fibonacci grid. The degree of waves in the indicator settings corresponds to a 1-hour timeframe - this is the main mode of working with the indicator. I also recommend using weekly (for evaluating large movements) and 1-minute timeframes.
When using other timeframes, the baseline of the indicator will correspond to:
1 min-Submicro
5 minutes-Micro
15 minutes-Subminuette
1 hour-Minuette
4 hours-Minute
Day-Minor
Week-Intermediate
Month-Primary
Those who are well versed in the Elliott method can see that the waves fall on the indicator almost perfectly. To demonstrate this, I put the markup on the graph
版本注释
Added 3 levels of trading signals. The entry is carried out on a correction, counting on the resumption of the trend. The color of the signal corresponds to this trend.版本注释
Added a pair of Minuette signals. Added filters for all signals: rejected signals on too fast and too slow trend版本注释
Filtering is now optional版本注释
The filter has been changed. Now only signals that are very far from the old trend line are rejected版本注释
All blue signals directed against the red trend have been removed版本注释
-- The visualization of signals has been changed -- The indicator colors are now tied to the degrees of the waves, regardless of the timeframe. For example, for Line 1(the fastest indicator line) for different timeframes, the colors (by default) will be as follows:
1 min-Submicro blue
5 minutes-Micro green
15 minutes-Subminuette red
1 hour-Minuette blue
4 hours-Minute green
Day-Minor red
Week-Intermediate blue
Month-Primary green
版本注释
-- The script is adapted for version 5 of the Pine editor-- Added line 0, which participates in the formation of sell1/buy1 signals. By default, it is not displayed
-- Lines 4 and 5 are now not displayed by default for ease of perception
开源脚本
秉承TradingView的精神,该脚本的作者将其开源,以便交易者可以查看和验证其功能。向作者致敬!您可以免费使用该脚本,但请记住,重新发布代码须遵守我们的网站规则。
免责声明
这些信息和出版物并非旨在提供,也不构成TradingView提供或认可的任何形式的财务、投资、交易或其他类型的建议或推荐。请阅读使用条款了解更多信息。
开源脚本
秉承TradingView的精神,该脚本的作者将其开源,以便交易者可以查看和验证其功能。向作者致敬!您可以免费使用该脚本,但请记住,重新发布代码须遵守我们的网站规则。
免责声明
这些信息和出版物并非旨在提供,也不构成TradingView提供或认可的任何形式的财务、投资、交易或其他类型的建议或推荐。请阅读使用条款了解更多信息。