OPEN-SOURCE SCRIPT
已更新 20-34 Dual Dot Alerts Only
Pine Script that uses dual Donchian Channels (20-period and 34-period) and places tiny blue dots above candles when the highest price touches any upper Donchian Channel and below candles when the lowest price touches any lower Donchian Channel, without displaying the channels themselves, you can use the code.
### Explanation of the Code:
1. **Indicator Declaration**: The script is named "Dual Donchian Channels Dots Only" and overlays on the price chart.
2. **Input for Lengths**: Users can set lengths for two Donchian Channels (20 and 34 periods).
3. **Calculating Bands**: The upper and lower bands are calculated using `ta.highest` and `ta.lowest` functions over the specified periods.
4. **Touch Conditions**:
- `upperTouch`: Checks if the highest price of the current candle touches either of the upper bands.
- `lowerTouch`: Checks if the lowest price of the current candle touches either of the lower bands.
5. **Plotting Dots**:
- A tiny blue dot is plotted above bars where `upperTouch` is true.
- A tiny blue dot is plotted below bars where `lowerTouch` is true.
### How to Use:
1. Copy this script into TradingView’s Pine Script editor.
2. Save it and add it to your chart.
3. You will see tiny blue dots appear above or below candles based on whether they touch any of the upper or lower Donchian Bands.
This setup provides a clear visual indication of price interactions with both Donchian Channels while keeping the chart uncluttered by hiding the channel lines.
版本注释
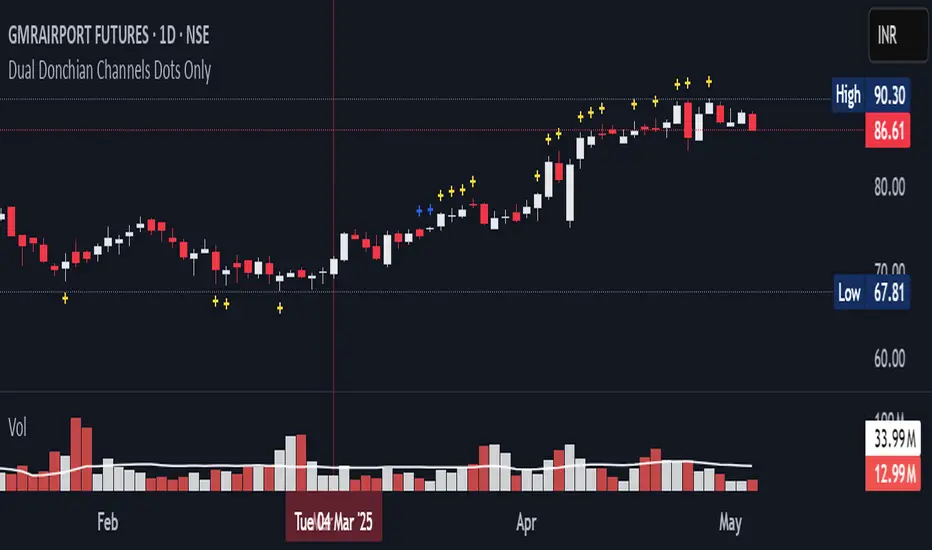
Spot key price reactions with clean, minimalist signals when price tests single or dual Donchian Channel boundaries.🔍 Overview
This indicator identifies potential reversal zones by plotting discrete dots when price touches:
Single Donchian Channel (20-period or 34-period extremes → Blue dots)
Double Donchian Channel (20-period and 34-period extremes → Yellow dots)
Perfect for traders who want:
✅ Visual clarity – No cluttered lines, only actionable dots.
✅ Multi-timeframe confirmation – Dual-channel touches highlight stronger levels.
✅ Customizable periods – Adapt to any trading style (intraday/swing).
版本注释
Earlier script had some errors. They have been now fixed.开源脚本
秉承TradingView的精神,该脚本的作者将其开源,以便交易者可以查看和验证其功能。向作者致敬!您可以免费使用该脚本,但请记住,重新发布代码须遵守我们的网站规则。
Learning smoothly & executing confidently.
免责声明
这些信息和出版物并非旨在提供,也不构成TradingView提供或认可的任何形式的财务、投资、交易或其他类型的建议或推荐。请阅读使用条款了解更多信息。
开源脚本
秉承TradingView的精神,该脚本的作者将其开源,以便交易者可以查看和验证其功能。向作者致敬!您可以免费使用该脚本,但请记住,重新发布代码须遵守我们的网站规则。
Learning smoothly & executing confidently.
免责声明
这些信息和出版物并非旨在提供,也不构成TradingView提供或认可的任何形式的财务、投资、交易或其他类型的建议或推荐。请阅读使用条款了解更多信息。