INVITE-ONLY SCRIPT
已更新 MACD by TimeDimenSion
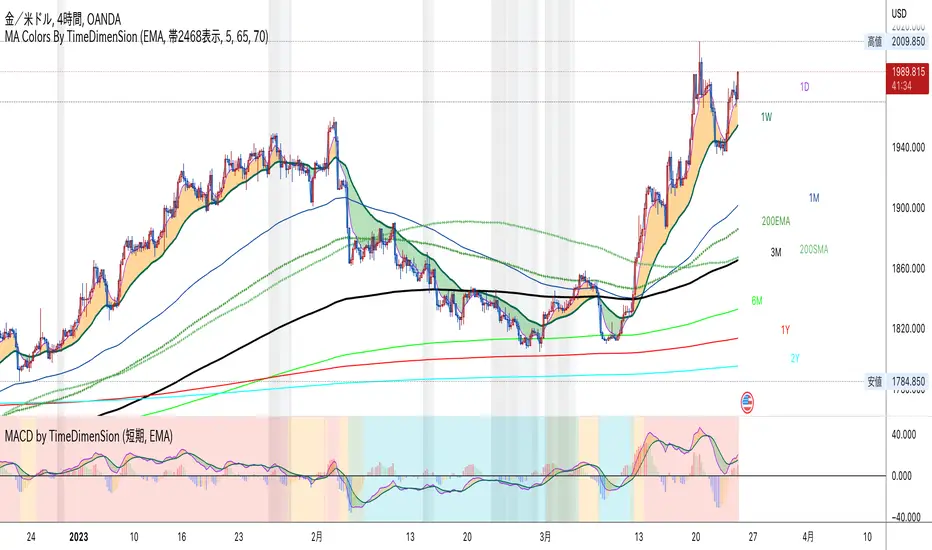
MACD is an indicator that shows changes in the strength of a trend by displaying changes in the distance between two moving averages.
Therefore, if the average period setting of the moving average displayed on the main chart and the period setting of the MACD do not match, it cannot be analyzed correctly.
This indicator is designed to link the period setting with an indicator showing another moving average.
Therefore, even if the periods of the two moving averages displayed for each time frame are different, it is always possible to correctly measure and display the distance between the two moving averages.
The background color indicates the basic trend of the time period being viewed.
(The trend is determined by the sequence of the three moving averages from the shortest to the longest.)
The MACD itself is also colored to make it easier to sense changes in trend.
MACDは2本の移動平均線の距離の変化を表示しトレンドの強さの変化を示してくれるインジケーターです。
そのため、メインチャートに表示している移動平均線の平均期間設定とMACDの期間設定が一致していなければ、正しく分析する事ができません。
このインジケーターは、別の移動平均線を示すインジケーターと設定期間がリンクするよう設計されています。
ですから、時間足ごとに表示される2本の移動平均線の期間が異なっていても、常に正しく、2本の移動平均線の距離を計測し、表示する事が可能です。
背景色は見ている時間足の基本トレンドを表します。
(短い方から3本の移動平均線の並びによって、トレンドを判定しています)
MACD自体にも色をつけて、トレンドの変化を感じ取りやすく設計されています。
版本注释
Monthly and Seconds indicators are now supported.Aligned with other indicators.
月足と秒足に対応しました。
他のインジケーターと整合しました。
仅限邀请脚本
只有作者授权的用户才能访问此脚本。您需要申请并获得使用许可。通常情况下,付款后即可获得许可。更多详情,请按照下方作者的说明操作,或直接联系kowatasan。
请注意,此私密、仅限邀请脚本未经脚本版主审核,是否符合网站规则尚未确定。 TradingView不建议您付费购买或使用任何脚本,除非您完全信任其作者并了解其工作原理。您也可以在我们的社区脚本找到免费的开源替代方案。
作者的说明
If you are interested in the invitation-only indicator, please contact us on private chat. この招待専用インジに興味ある方はプライベートチャットに連絡をください。
1人で悩まず、LINE公式登録
(インジ他無料プレゼント増量)
line.me/ti/p/@211ywenv
ユーチューバー対談
youtube.com/playlist?list=PL2sT2s7dIWWVYNuPLepsNNRRVCjQCqPUV
無料で学べるトレーダーズクラブ
liz-asset-design.com/
TicTokで時短動画配信中
tiktok.com/@akihikokowata
(インジ他無料プレゼント増量)
line.me/ti/p/@211ywenv
ユーチューバー対談
youtube.com/playlist?list=PL2sT2s7dIWWVYNuPLepsNNRRVCjQCqPUV
無料で学べるトレーダーズクラブ
liz-asset-design.com/
TicTokで時短動画配信中
tiktok.com/@akihikokowata
免责声明
这些信息和出版物并非旨在提供,也不构成TradingView提供或认可的任何形式的财务、投资、交易或其他类型的建议或推荐。请阅读使用条款了解更多信息。