OPEN-SOURCE SCRIPT
Currency Conversion Chart
Releasing this utility indicator I made for myself and thought others may find it helpful.
It is a simple currency conversion indicator. I personally trade both the TSX and the NYSE and hold both CAD and USD. As such, when I take positions in either or, I like to track how the currency I hold is affecting my position.
What the indicator does:
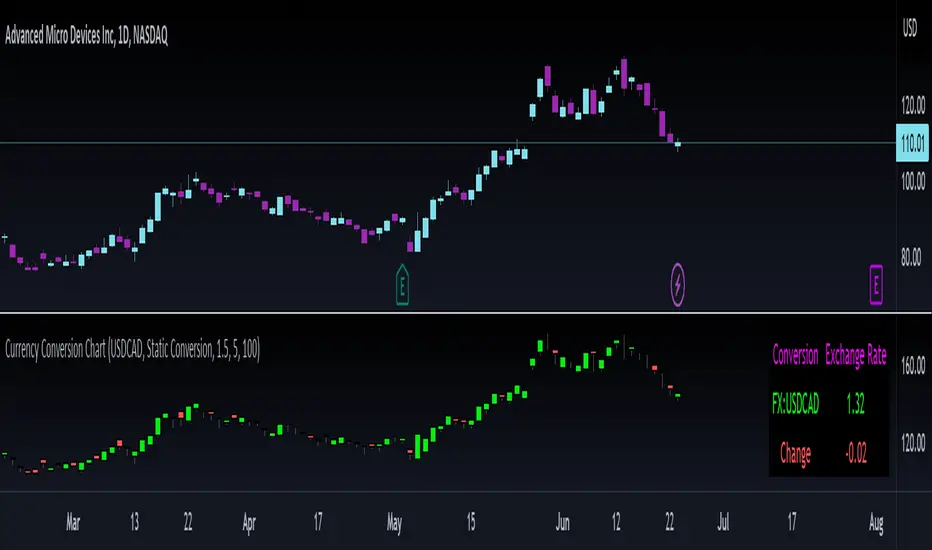
So, as indicated above, it converts a ticker's candlestick chart into the designated currency. You can either manually set the currency exchange rate, or search the currency exchange chart on Tradingview and it will auto-convert:

Purple arrow: The purple arrow points to the auto-input. You can search the currency you want to convert and it will automatically apply the conversion. It defaults to USD to CAD, but you can do USD to JPY, AUD to CAD, whatever currency you want provided it is available on tradingview. Alternatively, you can select manual conversion and input the manual conversion rate to apply.
Green Arrow: The green arrow refers to the conversion type. The indicator will default to static auto. This will pull the previous daily close. As currency trades at all hours, real-time is not advisable because the currency is in constant flux. Static will provide more stable results. However, you can toggle between the two. You can also just toggle Manual conversion.

Yellow arrow and red arrow: These pertain to position management. The indicator will display the change in the currency price over the designated amount of days. If you want to know how much the currency has changed in price over the last 7 or 20 days, simply put that value in the change input.
When you click manage position, you can fill out the position size variable and put the number of days you have had the position in the change parameter. This is the cost of your position. It can be options or shares. It will then adjust your position cost for the current change in the currency based on the number of days you have held it.
The indicator can be viewed on any timeframe and you can see how the conversion price compares to the listed price.
And that's basically the indicator! Its a simple utility indicator and hopefully some people will find use from it like I do!
Safe trades everyone, take care.
It is a simple currency conversion indicator. I personally trade both the TSX and the NYSE and hold both CAD and USD. As such, when I take positions in either or, I like to track how the currency I hold is affecting my position.
What the indicator does:
So, as indicated above, it converts a ticker's candlestick chart into the designated currency. You can either manually set the currency exchange rate, or search the currency exchange chart on Tradingview and it will auto-convert:
Purple arrow: The purple arrow points to the auto-input. You can search the currency you want to convert and it will automatically apply the conversion. It defaults to USD to CAD, but you can do USD to JPY, AUD to CAD, whatever currency you want provided it is available on tradingview. Alternatively, you can select manual conversion and input the manual conversion rate to apply.
Green Arrow: The green arrow refers to the conversion type. The indicator will default to static auto. This will pull the previous daily close. As currency trades at all hours, real-time is not advisable because the currency is in constant flux. Static will provide more stable results. However, you can toggle between the two. You can also just toggle Manual conversion.
Yellow arrow and red arrow: These pertain to position management. The indicator will display the change in the currency price over the designated amount of days. If you want to know how much the currency has changed in price over the last 7 or 20 days, simply put that value in the change input.
When you click manage position, you can fill out the position size variable and put the number of days you have had the position in the change parameter. This is the cost of your position. It can be options or shares. It will then adjust your position cost for the current change in the currency based on the number of days you have held it.
The indicator can be viewed on any timeframe and you can see how the conversion price compares to the listed price.
And that's basically the indicator! Its a simple utility indicator and hopefully some people will find use from it like I do!
Safe trades everyone, take care.
开源脚本
秉承TradingView的精神,该脚本的作者将其开源,以便交易者可以查看和验证其功能。向作者致敬!您可以免费使用该脚本,但请记住,重新发布代码须遵守我们的网站规则。
Get:
- Live Updates,
- Discord access,
- Access to my Proprietary Merlin Software,
- Access to premium indicators,
patreon.com/steversteves
Now on X!
- Live Updates,
- Discord access,
- Access to my Proprietary Merlin Software,
- Access to premium indicators,
patreon.com/steversteves
Now on X!
免责声明
这些信息和出版物并非旨在提供,也不构成TradingView提供或认可的任何形式的财务、投资、交易或其他类型的建议或推荐。请阅读使用条款了解更多信息。