OPEN-SOURCE SCRIPT
Interactive trendline
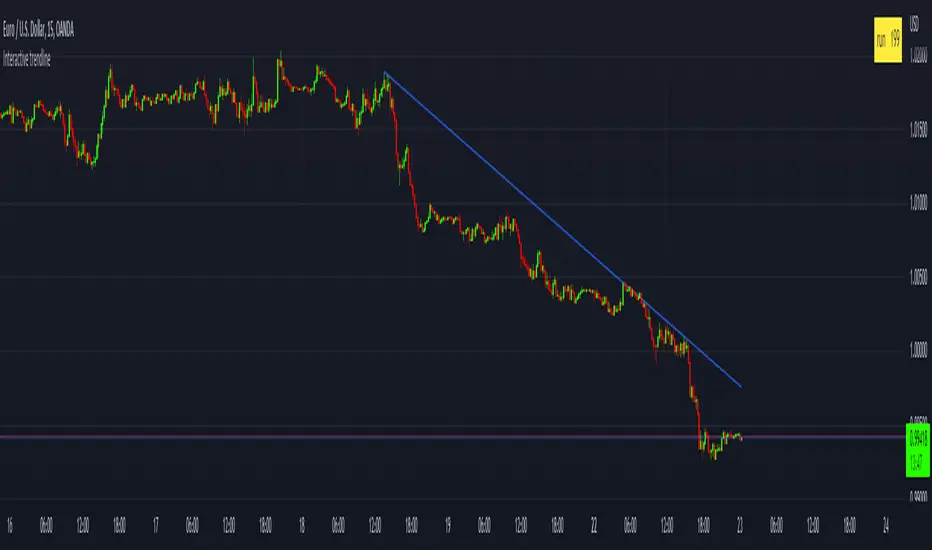
This is a concept that I have been playing with
to make a manual trend line that has more then just two connecting dots
but that has sequential data connected on every bar between the
beginning an the end point that can then be used to determine a break of trend or
a bounce.
This is added in a few simple steps
1) add the indicator to your chart
2) set the x_1 time bar
3) set the y_1 price
4) set the x_2 time bar
5) set the y_2 price
6) check the table that calculated the run value and enter that value in the settings box in the "Run" input box
开源脚本
秉承TradingView的精神,该脚本的作者将其开源,以便交易者可以查看和验证其功能。向作者致敬!您可以免费使用该脚本,但请记住,重新发布代码须遵守我们的网站规则。
免责声明
这些信息和出版物并非旨在提供,也不构成TradingView提供或认可的任何形式的财务、投资、交易或其他类型的建议或推荐。请阅读使用条款了解更多信息。
开源脚本
秉承TradingView的精神,该脚本的作者将其开源,以便交易者可以查看和验证其功能。向作者致敬!您可以免费使用该脚本,但请记住,重新发布代码须遵守我们的网站规则。
免责声明
这些信息和出版物并非旨在提供,也不构成TradingView提供或认可的任何形式的财务、投资、交易或其他类型的建议或推荐。请阅读使用条款了解更多信息。