OPEN-SOURCE SCRIPT
Range Percent Histogram

📌 Range Percent Histogram – Indicator Description
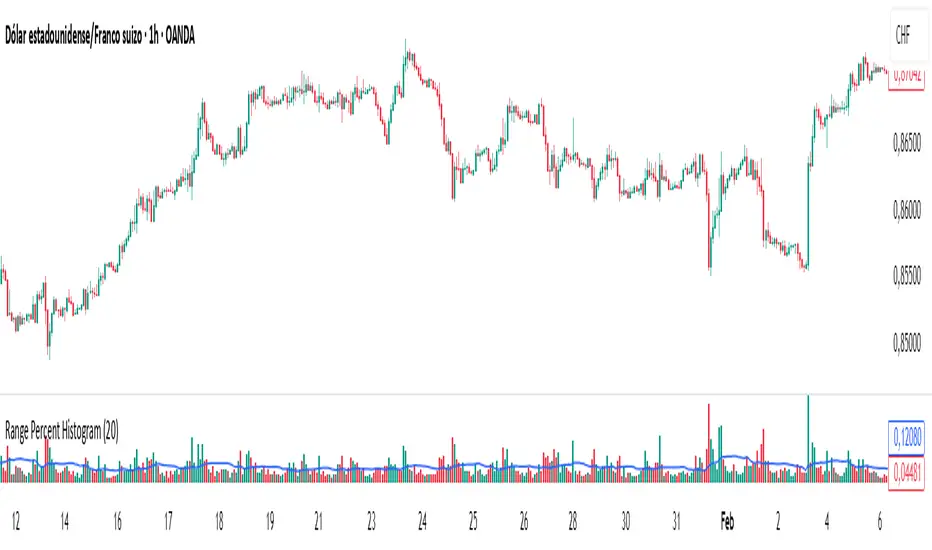
The Range Percent Histogram is a custom indicator that behaves like a traditional volume histogram, but instead of showing traded volume it displays the percentage range of each candle.
In other words, the height of each bar represents how much the price moved (in percentage terms) within that candle, from its low to its high.
🔧 What it shows
The indicator has two main components:
Component Description
Histogram Bars Columns plotted in red or green depending on the candle direction (green = bullish candle, red = bearish). The height of each bar = (high - low) / low * 100. That means a candle that moved, for example, 1 % from its lowest point to its highest point will show a bar with 1 % height.
Moving Average (optional) A 20-period Simple Moving Average applied directly to the bar values. It can be turned ON/OFF via a checkbox and helps you detect whether current range activity is above or below the average range of the past candles.
⚙️ How it works
Every time a new candle closes, the indicator calculates its range and converts it into a percentage.
This value is drawn as a column under the chart.
If the closing price is above the opening price → the bar is green (bullish range).
If the closing price is below the opening price → the bar is red (bearish range).
When the Show Moving Average option is enabled, a smooth line is plotted on top of the histogram representing the average percentage range of the last 20 candles.
📈 How to use it
This indicator is very helpful for detecting moments of range expansion or contraction.
One powerful way to use it is similar to a volume exhaustion / low-volume pattern:
Situation Interpretation
Consecutive bars with very low height Price is in a period of low volatility → possible accumulation or "pause" phase.
A sudden large bar after a series of small ones Indicates a strong pickup in volatility → often marks the start of a new impulse in the direction of the breakout.
开源脚本
秉承TradingView的精神,该脚本的作者将其开源,以便交易者可以查看和验证其功能。向作者致敬!您可以免费使用该脚本,但请记住,重新发布代码须遵守我们的网站规则。
免责声明
这些信息和出版物并非旨在提供,也不构成TradingView提供或认可的任何形式的财务、投资、交易或其他类型的建议或推荐。请阅读使用条款了解更多信息。
开源脚本
秉承TradingView的精神,该脚本的作者将其开源,以便交易者可以查看和验证其功能。向作者致敬!您可以免费使用该脚本,但请记住,重新发布代码须遵守我们的网站规则。
免责声明
这些信息和出版物并非旨在提供,也不构成TradingView提供或认可的任何形式的财务、投资、交易或其他类型的建议或推荐。请阅读使用条款了解更多信息。