OPEN-SOURCE SCRIPT
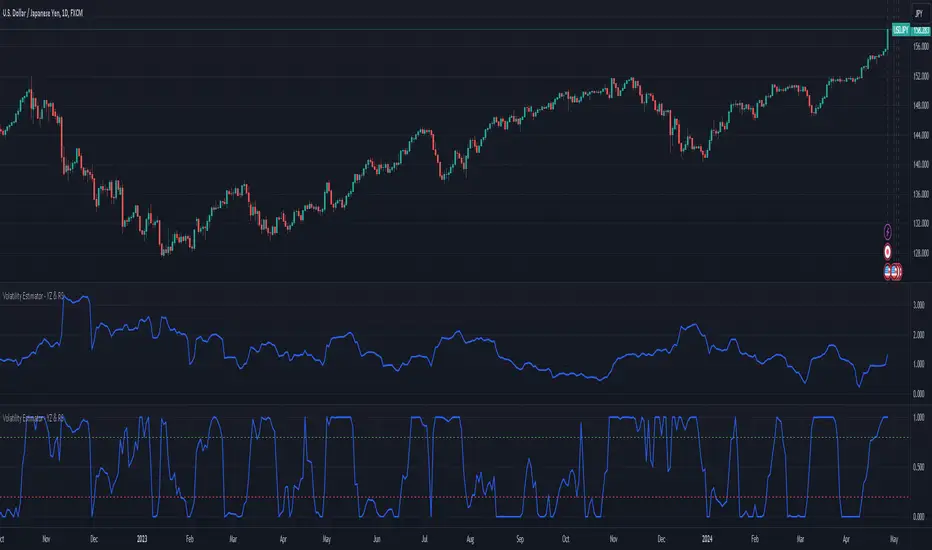
Volatility Estimator - YZ & RS
The Yang-Zheng Volatility Estimator (YZVE) integrates both intra-candle and inter-candle dynamics, such as overnight and weekend price changes, offering a more detailed analysis compared to traditional methods. The YZVE is proposed to improve over the standard deviation by accounting for the open, high, low, and close prices of trading periods, instead of only the close prices, and attempts to supplant the Parkinson's Volatility Estimator (PVE) by a also capturing inter-candle dynamics. The YZVE is calculated by this formula:
YZ Volatility Squared σ_YZ² = k * σ_o² + σ_rs² + (1 - k) * σ_c²
where k is a weighting factor that adjusts the emphasis between the overnight and close-to-close components, popularly estimated as:
k = 0.34 / (1.34 + (N+1) / (N-1))
where N is the lookback period. Optionally, users may opt to override this calculation with a specified constant (off by default). Next, the
Overnight Volatility Squared σ_o² = (log(O_t / C_(t-1)))²
measures the volatility associated with overnight price changes, from the previous candle's closing price C_(t-1) to the current candle's opening price O_t. It captures the market's reaction to news and events that occur outside of regular trading hours to reflect risk associated with holding positions over non-trading hours and gaps.
Next, the The Rogers-Satchell Volatility Estimator (RSVE) serves as an intermediary step in the computation of YZVE. It aggregates the logarithmic ratios between high, low, open, and close prices within each trading period, focusing on intra-candle volatility without assuming zero inter-candle drift as commonly implicitly assumed in other volatility models:
Rogers-Satchell Volatility Squared σ_rs² = (log(H_t / C_t) * log(H_t / O_t)) + (log(L_t / C_t) * log(L_t / O_t))
Finally,
Close-to-Close Volatility Squared σ_c² = (log(C_t / C_(t-1)))²
measures the volatility from the close of one candle to the close of the next. It reflects the typical candle volatility, similar to naive standard deviation.
This script also includes an option for users to apply the simpler RS Volatility exclusively, focusing on intraday price movements. Additionally, it offers a choice for normalization between 0 and 1, turning the estimator into an oscillator for comparing current volatility to recent levels. Horizontal lines at user-defined levels are also available for clearer visualization. Both are off by default.
References:
Yang, D., & Zhang, Q. (2000). Drift-independent volatility estimation based on high, low, open, and close prices. The Journal of Business, 73(3), 477-491.
Rogers, L.C.G., & Satchell, S.E. (1991). Estimating variance from high, low and closing prices. Annals of Applied Probability, 1(4), 504-512.
开源脚本
秉承TradingView的精神,该脚本的作者将其开源,以便交易者可以查看和验证其功能。向作者致敬!您可以免费使用该脚本,但请记住,重新发布代码须遵守我们的网站规则。
免责声明
这些信息和出版物并非旨在提供,也不构成TradingView提供或认可的任何形式的财务、投资、交易或其他类型的建议或推荐。请阅读使用条款了解更多信息。
免责声明
这些信息和出版物并非旨在提供,也不构成TradingView提供或认可的任何形式的财务、投资、交易或其他类型的建议或推荐。请阅读使用条款了解更多信息。