OPEN-SOURCE SCRIPT
已更新 Volatility Meter
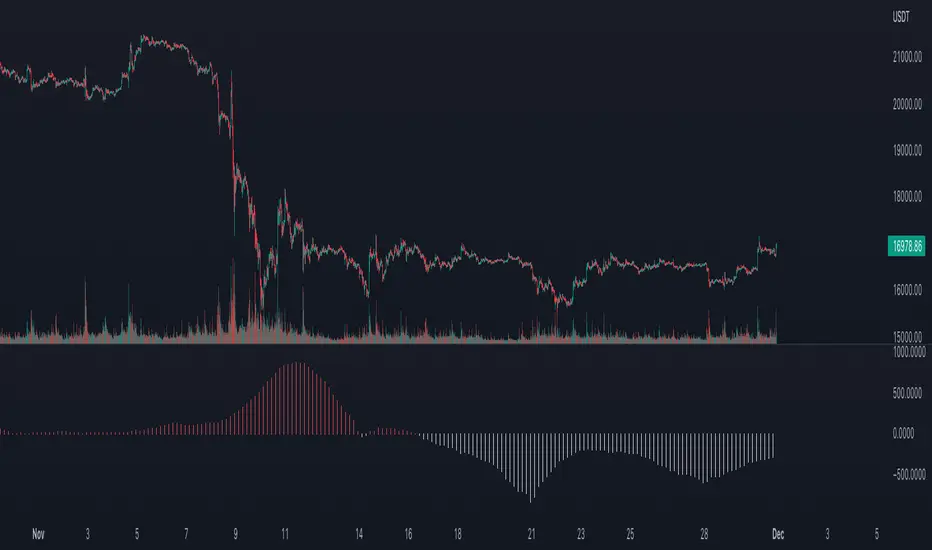
The title is quite self explanatory. It is a Volatility Meter based on Bollinger Bands Width and MA.
These parameters can be selected by users in settings tab:
- Basic Bollinger Bands Parameters: length, standart deviation and source
- Timeframes: 1h, 2h, 3h and 4h
If the indicator is red it means volatility is high in the market. If it is white, it means that market is not volatile right now.
These parameters can be selected by users in settings tab:
- Basic Bollinger Bands Parameters: length, standart deviation and source
- Timeframes: 1h, 2h, 3h and 4h
If the indicator is red it means volatility is high in the market. If it is white, it means that market is not volatile right now.
版本注释
The title is self-explanatory. It is a Volatility Meter based on Bollinger Bands Width and Moving Averages. It also uses the concept of multi-time frame analysis.You can decide the options below on the settings tab:
- Basic Bollinger Bands Parameters: length, standart deviation and source
- Timeframes: 1h, 2h, 3h and 4h
If the indicator is red, it means volatility is high in the market. If it is white, it means the market is not volatile right now. If you use it in a smaller timeframe than it is calculated then you will get the multi-timeframe analysis of the volatility. As could be seen on the chart above, if it is red it usually means that big market moves are expected.
Use it on 4H or smaller time frames to get the multi-time frame volatility insight. If you use it on the time frame greater than 4H please select the calculated time frame accordingly. (NOTE: credits on the source code is removed.)
开源脚本
秉承TradingView的精神,该脚本的作者将其开源,以便交易者可以查看和验证其功能。向作者致敬!您可以免费使用该脚本,但请记住,重新发布代码须遵守我们的网站规则。
免责声明
这些信息和出版物并非旨在提供,也不构成TradingView提供或认可的任何形式的财务、投资、交易或其他类型的建议或推荐。请阅读使用条款了解更多信息。
免责声明
这些信息和出版物并非旨在提供,也不构成TradingView提供或认可的任何形式的财务、投资、交易或其他类型的建议或推荐。请阅读使用条款了解更多信息。