OPEN-SOURCE SCRIPT
已更新 MACD with Trend
Indicator Name: MACD with Trend & Multi-Timeframe Dashboard
Why Use This Indicator?
Two MACDs for Double Confirmation:
It integrates both a standard MACD (fast/slow lengths of your choice) and a Trend MACD (longer lengths). The standard MACD identifies short-term momentum shifts, while the Trend MACD helps confirm the higher-level market trend.
Multi-Timeframe 50/200 SMA Overview:
A built-in dashboard quickly shows whether the 50-period moving average is above or below the 200-period moving average across multiple timeframes (Monthly, Weekly, Daily, etc.). At a glance, you can see if higher timeframes agree with your immediate trading setup.
Clear Buy/Sell Signals:
The script plots buy arrows when the MACD histogram crosses from negative to positive, plus an additional label for the Trend MACD crossing. The same goes for sell signals if momentum flips from positive to negative. This clarity can reduce guesswork.
Customizable & Intuitive:
Easily adjust moving average types (SMA or EMA), lengths, and source inputs to suit different asset classes or personal preferences. Visual color coding helps you quickly interpret bullish vs. bearish conditions.
Recommended Trading Approach
Identify Overall Trend
Check the Trend MACD histogram and the multi-timeframe dashboard (50/200 SMAs). If you see bullish alignment on higher timeframes (e.g., Daily, Weekly) and the Trend MACD is above zero, you know the market environment is supportive for long trades.
Pinpoint Entry Using Standard MACD
Wait for the standard MACD histogram to cross above zero or for a labeled “Buy Signal.” This indicates short-term momentum turning bullish in sync with the broader trend. If the market is already trending up (confirmed by the dashboard), the probability of a successful long entry often improves.
Set a Stop-Loss & Take-Profit
While not included in the code, adding an ATR- or price-based stop-loss can protect against sudden reversals. A simple approach is risking 1–2% per trade and aiming for a 1.5–2× reward relative to that risk.
Monitor Sell Signals
If the short-term MACD crosses below zero—triggering a “Sell Signal”—and the Trend MACD also turns down (or the dashboard flips bearish), consider exiting the position or tightening stops. This alignment of short- and long-term indicators often signals a shift in momentum that could threaten your open profits.
Summary
The MACD with Trend & Multi-Timeframe Dashboard is a versatile, all-in-one toolkit. It combines the immediacy of short-term MACD signals, the validation of a longer-term trend oscillator, and the broader insight of multi-timeframe moving averages. Whether you are a swing trader looking for alignment across bigger trends or a shorter-term trader wanting clear momentum triggers, this indicator helps streamline decision-making and reduce noise.
Disclaimer: As with all technical analysis tools, there is no guarantee of success. Always combine indicator signals with sound risk management and a thorough understanding of market conditions
版本注释
Indicator Name: MACD with Trend & Multi-Timeframe DashboardWhy Use This Indicator?
Two MACDs for Double Confirmation:
It integrates both a standard MACD (fast/slow lengths of your choice) and a Trend MACD (longer lengths). The standard MACD identifies short-term momentum shifts, while the Trend MACD helps confirm the higher-level market trend.
Multi-Timeframe 50/200 SMA Overview:
A built-in dashboard quickly shows whether the 50-period moving average is above or below the 200-period moving average across multiple timeframes (Monthly, Weekly, Daily, etc.). At a glance, you can see if higher timeframes agree with your immediate trading setup.
Clear Buy/Sell Signals:
The script plots buy arrows when the MACD histogram crosses from negative to positive, plus an additional label for the Trend MACD crossing. The same goes for sell signals if momentum flips from positive to negative. This clarity can reduce guesswork.
Customizable & Intuitive:
Easily adjust moving average types (SMA or EMA), lengths, and source inputs to suit different asset classes or personal preferences. Visual color coding helps you quickly interpret bullish vs. bearish conditions.
Recommended Trading Approach
Identify Overall Trend
Check the Trend MACD histogram and the multi-timeframe dashboard (50/200 SMAs). If you see bullish alignment on higher timeframes (e.g., Daily, Weekly) and the Trend MACD is above zero, you know the market environment is supportive for long trades.
Pinpoint Entry Using Standard MACD
Wait for the standard MACD histogram to cross above zero or for a labeled “Buy Signal.” This indicates short-term momentum turning bullish in sync with the broader trend. If the market is already trending up (confirmed by the dashboard), the probability of a successful long entry often improves.
Set a Stop-Loss & Take-Profit
While not included in the code, adding an ATR- or price-based stop-loss can protect against sudden reversals. A simple approach is risking 1–2% per trade and aiming for a 1.5–2× reward relative to that risk.
Monitor Sell Signals
If the short-term MACD crosses below zero—triggering a “Sell Signal”—and the Trend MACD also turns down (or the dashboard flips bearish), consider exiting the position or tightening stops. This alignment of short- and long-term indicators often signals a shift in momentum that could threaten your open profits.
Summary
The MACD with Trend & Multi-Timeframe Dashboard is a versatile, all-in-one toolkit. It combines the immediacy of short-term MACD signals, the validation of a longer-term trend oscillator, and the broader insight of multi-timeframe moving averages. Whether you are a swing trader looking for alignment across bigger trends or a shorter-term trader wanting clear momentum triggers, this indicator helps streamline decision-making and reduce noise.
Disclaimer: As with all technical analysis tools, there is no guarantee of success. Always combine indicator signals with sound risk management and a thorough understanding of market conditions
版本注释
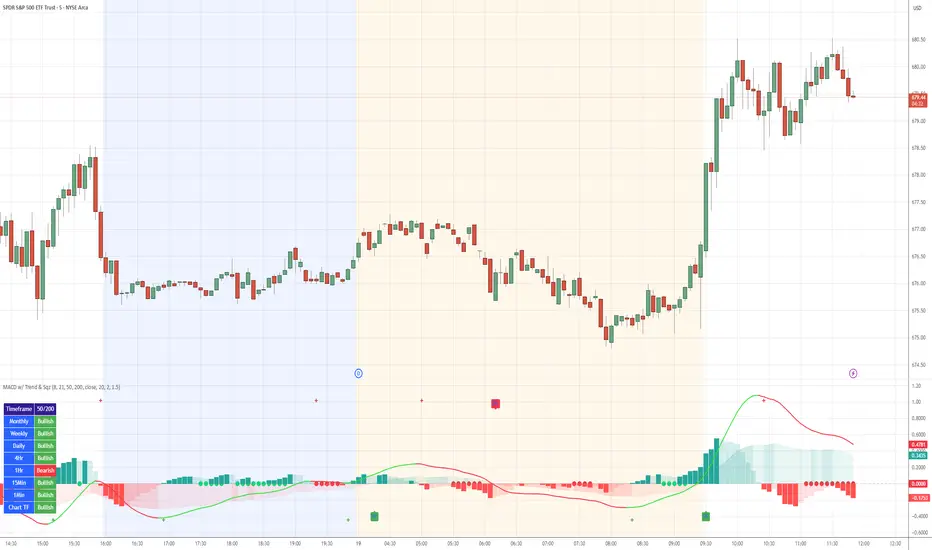
MACD with Trend now with Predictive Squeeze 🚀 Overview
This indicator is a complete trading system that combines three powerful concepts into a single oscillator: Momentum, Trend Direction, and Volatility Compression (The Squeeze).
By integrating a "Predictive Squeeze" directly onto the MACD zero line, this tool allows traders to identify explosive moves before they happen and gauge the probable direction based on internal momentum.
🛠 Key Features
1. Standard MACD (Columns)
The classic MACD histogram is displayed as columns.
- Green/Teal: Bullish Momentum.
- Red: Bearish Momentum.
2. Trend MACD (Background Area)
A slower, longer-term MACD is plotted in the background area to show the dominant market trend.
- Green Area: The long-term trend is UP.
- Red Area: The long-term trend is DOWN.
3. Predictive Squeeze (Zero Line Dots)
Located along the zero line, large dots appear when volatility compresses (Bollinger Bands move inside Keltner Channels). This indicates a big move is imminent.
🟢 Green Dot: Squeeze is ON, and internal momentum is POSITIVE (Bullish Bias).
🔴 Red Dot: Squeeze is ON, and internal momentum is NEGATIVE (Bearish Bias).
No Dot: The Squeeze has "fired" (Volatility has expanded).
4. Multi-Timeframe Dashboard
A panel checks the 50 SMA vs 200 SMA across multiple timeframes (Monthly down to 1-minute) to give you a "Traffic Light" view of the overall market health.
🎯 Recommended Trading Plan
The most effective way to trade this indicator is to look for Confluence—where the Momentum, Trend, and Squeeze all agree.
✅ The "Power Buy" Setup (Long)
Check the Background: Ensure the Trend Area (Background) is Green. This ensures you are trading with the major trend.
Check the Squeeze: Wait for Green Dots to appear on the zero line. This indicates the market is consolidating, but the internal pressure is building upwards.
The Trigger: Enter when the Green Dot disappears (The Squeeze Fires) and the MACD Histogram bars start expanding upwards.
🛑 The "Power Sell" Setup (Short)
Check the Background: Ensure the Trend Area (Background) is Red.
Check the Squeeze: Wait for Red Dots to appear on the zero line. This indicates the market is resting, but selling pressure is building internally.
The Trigger: Enter when the Red Dot disappears and the MACD Histogram bars expand downwards.
⚠️ The Warning Setup (Divergence)
If the Background Trend is Red but the Squeeze Dots are Green (or vice versa):
This indicates a Counter-Trend move.
Action: Exercise caution. These moves often result in short-lived corrections rather than full trend reversals. Wait for the long-term trend (Background) to flip color before taking a heavy position.
⚙️ Settings
Fast/Slow Length: Standard MACD settings (Default 12/26).
Trend Fast/Slow: Long-term Trend settings (Default 50/200).
Squeeze Settings: Adjustable BB/KC multipliers to tighten or loosen the squeeze detection logic.
Disclaimer: This tool is for educational purposes only. Past performance does not guarantee future results. Always manage risk.
开源脚本
秉承TradingView的精神,该脚本的作者将其开源,以便交易者可以查看和验证其功能。向作者致敬!您可以免费使用该脚本,但请记住,重新发布代码须遵守我们的网站规则。
免责声明
这些信息和出版物并非旨在提供,也不构成TradingView提供或认可的任何形式的财务、投资、交易或其他类型的建议或推荐。请阅读使用条款了解更多信息。
免责声明
这些信息和出版物并非旨在提供,也不构成TradingView提供或认可的任何形式的财务、投资、交易或其他类型的建议或推荐。请阅读使用条款了解更多信息。