INVITE-ONLY SCRIPT
Normalized MACD by[@hadi_saadat]
已更新
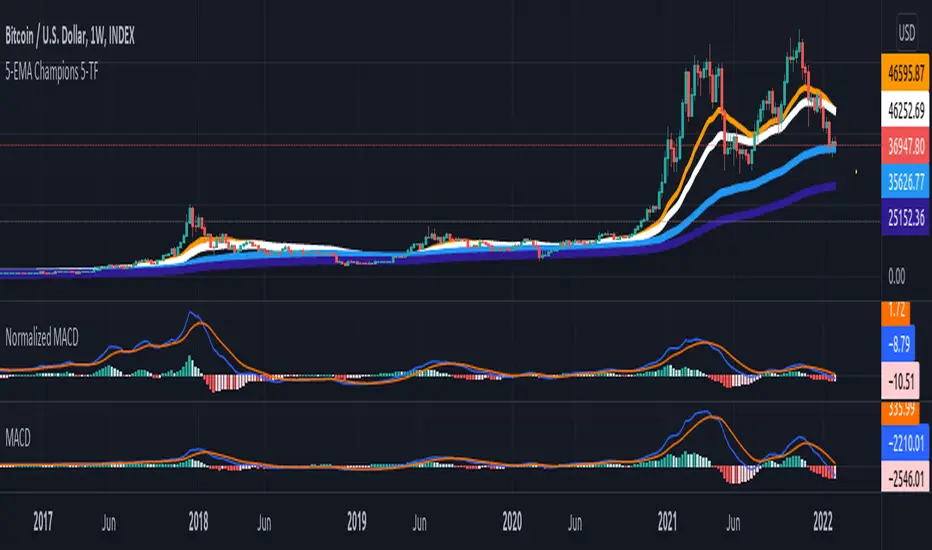
This MACD is exactly like standard MACD, but extremely stable and normalized by EMAs(200,150,100,50,30).
So you need at-least 30 candle to see the chart.
The Huge differences can be seen when the close price scale over time changes for instance go to the weekly time-frame, see the normalized MACD and Standard MACD when the BTC price was below 10k or even below 5k and compare two MACD charts (The standard one chart get almost vanished when the price was much cheaper and it doesnt scale well), then zoom in the standard MACD at that period and again compare it to The Normalized one(When you zoom in you will see surprisingly both MACDs are exactly the same form and shape, however normalized one doesn't need zoom-in and it is well scaled among the time and different prices), You will be surprised that how stable it is.
The normalizes MACDs, Signals and Histograms values are comparable to any other assets (obviously in same time-frame).
版本注释
The default precision for indicator values is updated to 3.仅限邀请脚本
仅限作者授权的用户访问此脚本,并且通常需要付费。您可以将其添加到收藏中,但是只有在向作者请求并获得许可之后,才能使用它。 请联系hadi_saadat了解更多信息,或按照以下作者的说明操作。
TradingView不建议付费使用脚本,除非您100%信任作者并了解脚本的工作原理。在许多情况下,您可以在我们的社区脚本免费找到不错的开源替代方案。
作者的说明
″just comment here for your request.
想在图表上使用此脚本?
警告:请在申请访问权限之前阅读。
免责声明
这些信息和出版物并不意味着也不构成TradingView提供或认可的金融、投资、交易或其它类型的建议或背书。请在使用条款阅读更多信息。