OPEN-SOURCE SCRIPT
Measured Move
This indicator was made for those who look to profit on “Measured Moves.”
Upon opening the settings one will need to set the time to begin (Start Time in settings) the colored background of the potential move areas, and the high (First Price Level in settings) and low (Second Price Level in settings) prices for the measured area for the measured move.
After those are selected they can be easily moved on the chart. I created a table for the user to tap with the pointer to highlight the setting lines for easy adjustment.
Measured moves are used by some algo’s and some traders to determine the take profit levels. They are moves from a particular pattern conclusion to a distance equal to that distance in the desired direction.
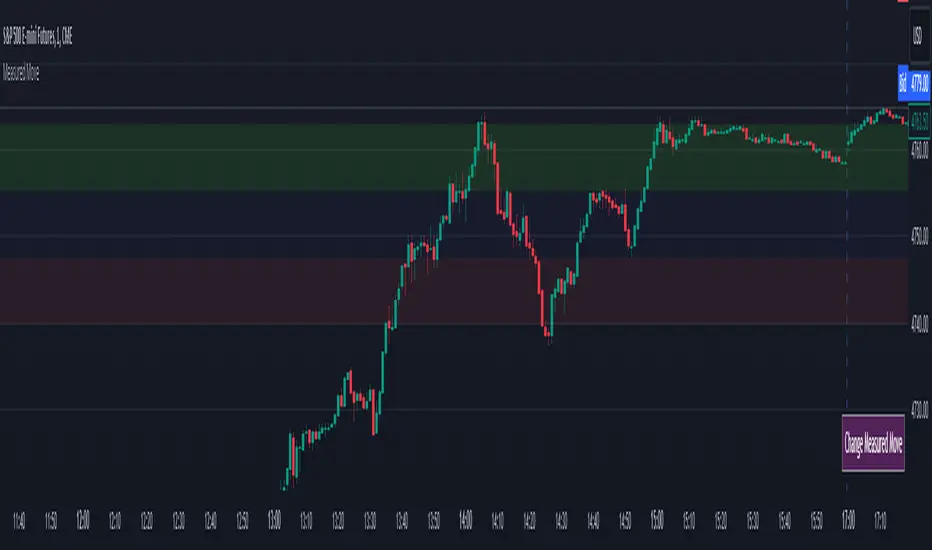
This is an image of the measured move which occurred on Dec 13th, 2023 at about 1pm on the ES 1m chart:

The center area in lightly shaded blue is the measured area. The green and red would be the same distance and would equate to the measured move distance.
This example shows the same day – the second move up was a measured move by some traders:
tradingview.com/x/qCOZssJF/J
Again, the same day on the way down. This one didn’t quite complete the move:

Again, same day on the way back up – almost perfect:

And, finally, the same day for the last move up:

This indicator will require the user to know what to look for in creating the measured movement. The script is quite simple – but, can be effective in assisting a user to know potential profit targets.
I conducted several searches for “measured move” and found no other indicators that provide this functionality. I understand that one could use fibs to do the same thing – but, I didn’t want to have to alter the fib settings (which I use for actual fibs) to perform this functionality.
Please comment with any questions/suggestions/etc.
Upon opening the settings one will need to set the time to begin (Start Time in settings) the colored background of the potential move areas, and the high (First Price Level in settings) and low (Second Price Level in settings) prices for the measured area for the measured move.
After those are selected they can be easily moved on the chart. I created a table for the user to tap with the pointer to highlight the setting lines for easy adjustment.
Measured moves are used by some algo’s and some traders to determine the take profit levels. They are moves from a particular pattern conclusion to a distance equal to that distance in the desired direction.
This is an image of the measured move which occurred on Dec 13th, 2023 at about 1pm on the ES 1m chart:
The center area in lightly shaded blue is the measured area. The green and red would be the same distance and would equate to the measured move distance.
This example shows the same day – the second move up was a measured move by some traders:
tradingview.com/x/qCOZssJF/J
Again, the same day on the way down. This one didn’t quite complete the move:
Again, same day on the way back up – almost perfect:
And, finally, the same day for the last move up:
This indicator will require the user to know what to look for in creating the measured movement. The script is quite simple – but, can be effective in assisting a user to know potential profit targets.
I conducted several searches for “measured move” and found no other indicators that provide this functionality. I understand that one could use fibs to do the same thing – but, I didn’t want to have to alter the fib settings (which I use for actual fibs) to perform this functionality.
Please comment with any questions/suggestions/etc.
开源脚本
秉承TradingView的精神,该脚本的作者将其开源,以便交易者可以查看和验证其功能。向作者致敬!您可以免费使用该脚本,但请记住,重新发布代码须遵守我们的网站规则。
免责声明
这些信息和出版物并非旨在提供,也不构成TradingView提供或认可的任何形式的财务、投资、交易或其他类型的建议或推荐。请阅读使用条款了解更多信息。
免责声明
这些信息和出版物并非旨在提供,也不构成TradingView提供或认可的任何形式的财务、投资、交易或其他类型的建议或推荐。请阅读使用条款了解更多信息。