已更新
Seasonal Tendency° [Pro+] by toodegrees
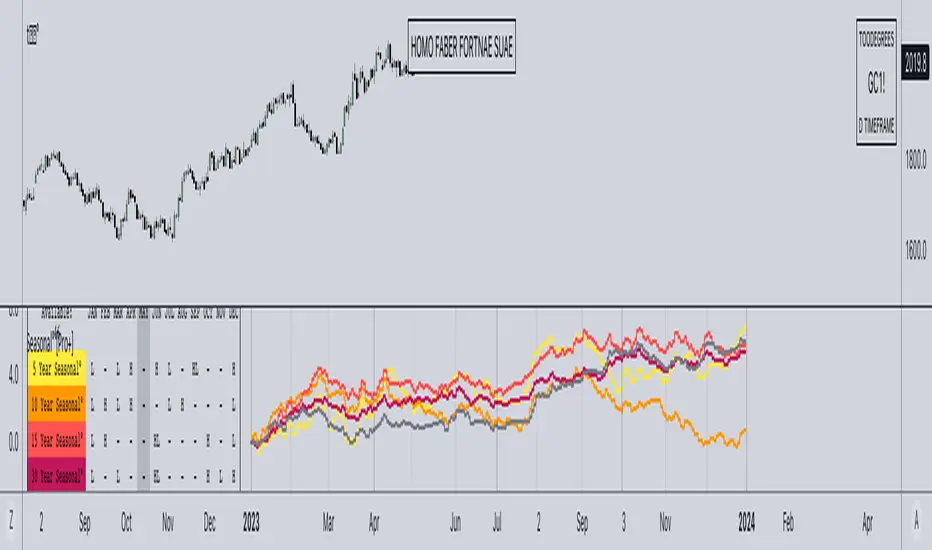
TRADINGVIEW IMAGE IS NOT DISPLAYING THE TOOL CORRECTLY, CHECK OUT THE IMAGES BELOW!
Description:
A Seasonal Tendency is a historical pattern or roadmap that reflects how price action has behaved in the past during specific time periods, usually on a monthly basis. It is not an absolute guarantee of future price movements, but rather a general rule of thumb to identify potential high-probability long-term trades. Seasonal tendencies can be used to analyze various pairs and asset classes, and when combined with the underlying market trends or conditions, they can help traders narrow down specific times of the year when big moves are more likely to occur.
Keep in mind that while these seasonal tendencies have been successfully compared with the Inner Circle Trader's go-to seasonal third-party provider and are based on sound statistical logic, their reliability is dependent on the data available on TradingView. This means that the accuracy and relevance of these tendencies may vary, but they still serve as valuable tools for identifying potential high-probability trading opportunities when used in conjunction with other market analysis techniques. Pay attention to the Years of Data used to determine the significance of the information for your trading hypotheses.
Tool Features:
Discover the power of our innovative tool that seamlessly integrates all available TradingView data to create a dynamic on-chart seasonal display:
– Monitor the 5, 10, 15, 30, and All Time Seasonal graphs with ease
– Effortlessly visualize and align the seasonal graphs with real-time prices for a holistic view
– Align the seasonal graph with the annual timeline, pinpointing precise moments for potential trading setups, keeping Months and Quarters in mind
– Read into the seasonality thanks to the Seasonal Lows and Highs Matrix
– Auto-detect the underlying Futures Contract's Asset Class
– Monitor the entire Asset Class' Seasonal Tendencies with a tailored Seasonal Lows and Highs Matrix
Find a Video Preview and the User Manual here.
Templates:
Dark Mode

Table+Overlay

Holy Seasonal
Collection of all Asset Classes for Commodity Futures in one place. Note: the number of dashboards depends on your Tradingview Plan.
To Get Access, and Level Up see the Author's Instructions below!
This indicator is available only on the TradingView platform.
⚠️ Intellectual Property Rights ⚠️
While this tool's base concepts are public, its interpretation, code, and presentation are protected intellectual property. Unauthorized copying or distribution is prohibited.
⚠️ Terms and Conditions ⚠️
This financial tool is for educational purposes only and not financial advice. Users assume responsibility for decisions made based on the tool's information. Past performance doesn't guarantee future results. By using this tool, users agree to these terms.
Description:
A Seasonal Tendency is a historical pattern or roadmap that reflects how price action has behaved in the past during specific time periods, usually on a monthly basis. It is not an absolute guarantee of future price movements, but rather a general rule of thumb to identify potential high-probability long-term trades. Seasonal tendencies can be used to analyze various pairs and asset classes, and when combined with the underlying market trends or conditions, they can help traders narrow down specific times of the year when big moves are more likely to occur.
Keep in mind that while these seasonal tendencies have been successfully compared with the Inner Circle Trader's go-to seasonal third-party provider and are based on sound statistical logic, their reliability is dependent on the data available on TradingView. This means that the accuracy and relevance of these tendencies may vary, but they still serve as valuable tools for identifying potential high-probability trading opportunities when used in conjunction with other market analysis techniques. Pay attention to the Years of Data used to determine the significance of the information for your trading hypotheses.
Tool Features:
Discover the power of our innovative tool that seamlessly integrates all available TradingView data to create a dynamic on-chart seasonal display:
– Monitor the 5, 10, 15, 30, and All Time Seasonal graphs with ease
– Effortlessly visualize and align the seasonal graphs with real-time prices for a holistic view
– Align the seasonal graph with the annual timeline, pinpointing precise moments for potential trading setups, keeping Months and Quarters in mind
– Read into the seasonality thanks to the Seasonal Lows and Highs Matrix
– Auto-detect the underlying Futures Contract's Asset Class
– Monitor the entire Asset Class' Seasonal Tendencies with a tailored Seasonal Lows and Highs Matrix
Find a Video Preview and the User Manual here.
Templates:
Dark Mode
Table+Overlay
Holy Seasonal
Collection of all Asset Classes for Commodity Futures in one place. Note: the number of dashboards depends on your Tradingview Plan.
To Get Access, and Level Up see the Author's Instructions below!
This indicator is available only on the TradingView platform.
⚠️ Intellectual Property Rights ⚠️
While this tool's base concepts are public, its interpretation, code, and presentation are protected intellectual property. Unauthorized copying or distribution is prohibited.
⚠️ Terms and Conditions ⚠️
This financial tool is for educational purposes only and not financial advice. Users assume responsibility for decisions made based on the tool's information. Past performance doesn't guarantee future results. By using this tool, users agree to these terms.
版本注释
Minor Changes版本注释
2025 Setting Override付费空间可用
此指标仅对Toodegrees Elite Collection订阅用户开放。加入订阅即可访问此指标以及toodegrees的其他脚本。
homo faber fortunæ suæ
免责声明
这些信息和出版物并非旨在提供,也不构成TradingView提供或认可的任何形式的财务、投资、交易或其他类型的建议或推荐。请阅读使用条款了解更多信息。
付费空间可用
此指标仅对Toodegrees Elite Collection订阅用户开放。加入订阅即可访问此指标以及toodegrees的其他脚本。
homo faber fortunæ suæ
免责声明
这些信息和出版物并非旨在提供,也不构成TradingView提供或认可的任何形式的财务、投资、交易或其他类型的建议或推荐。请阅读使用条款了解更多信息。