OPEN-SOURCE SCRIPT
Fibonacci Moving Average
Simple idea from an article I read online I decided to code:
Take EMA's for periods based on the fibonacci sequence - 3, 5, 8, 13, 21, 34, 55 etc. and average them into one MA - the result is the Fibonacci MA (FMA)
Therefore - note the FMA does not use Length - but Range/Interval of how many steps of the Fibonacci Sequence to include.
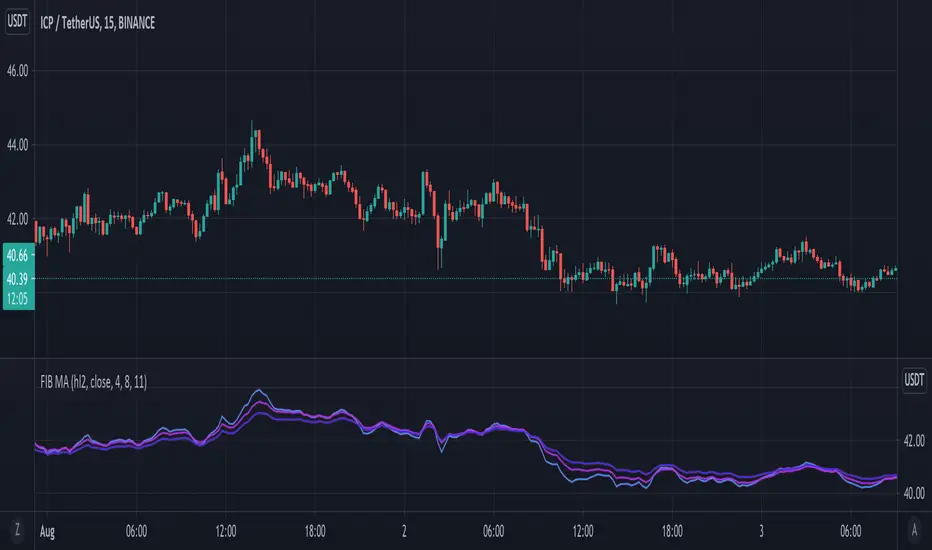
Seems to be good for finding support/resistance for the price - so added some extra features:
Using up to 3 in at different periods - when they stretch apart it means price is very deviated and will reverse.
Added a price OHLC line if you want to move the indicator to a sub-panel for nice visualisation.
I believe you could look at the 4, 8 and 10, where the longest MA (10,11 FMA) indicates overall bull or bear trend (whether on top or bottom) and you could probably code in alerts for price crossing up or crossing down on the faster (4 FMA)
Take EMA's for periods based on the fibonacci sequence - 3, 5, 8, 13, 21, 34, 55 etc. and average them into one MA - the result is the Fibonacci MA (FMA)
Therefore - note the FMA does not use Length - but Range/Interval of how many steps of the Fibonacci Sequence to include.
Seems to be good for finding support/resistance for the price - so added some extra features:
Using up to 3 in at different periods - when they stretch apart it means price is very deviated and will reverse.
Added a price OHLC line if you want to move the indicator to a sub-panel for nice visualisation.
I believe you could look at the 4, 8 and 10, where the longest MA (10,11 FMA) indicates overall bull or bear trend (whether on top or bottom) and you could probably code in alerts for price crossing up or crossing down on the faster (4 FMA)
开源脚本
秉承TradingView的精神,该脚本的作者将其开源,以便交易者可以查看和验证其功能。向作者致敬!您可以免费使用该脚本,但请记住,重新发布代码须遵守我们的网站规则。
免责声明
这些信息和出版物并非旨在提供,也不构成TradingView提供或认可的任何形式的财务、投资、交易或其他类型的建议或推荐。请阅读使用条款了解更多信息。
免责声明
这些信息和出版物并非旨在提供,也不构成TradingView提供或认可的任何形式的财务、投资、交易或其他类型的建议或推荐。请阅读使用条款了解更多信息。