INVITE-ONLY SCRIPT
已更新 RSI, CCI WaveTrend God by Keiron Richie
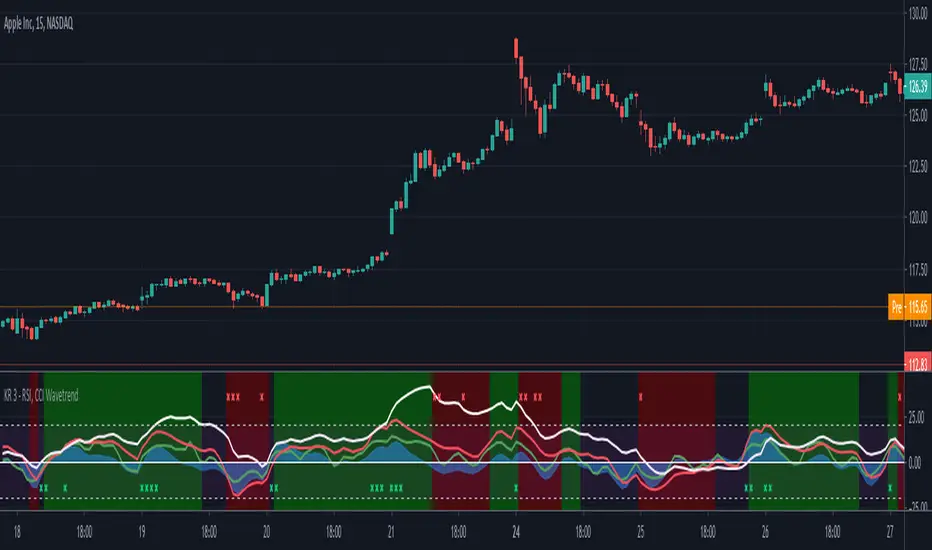
This script uses Relative Strength Index ( RSI ), Commodity Channel Index ( CCI ) and WaveTrend (WT) together as an oscillator with an additional custom RSI rate of change indicator and buy/sell background color zones derived from a complex combination of these indicators.
The White line shows the moving average of RSI as an oscillator
The Green line is the fast Exponential Moving Average ( EMA ) of CCI & the Red line is the slow EMA of CCI .
The Blue area is the EMA of WaveTrend WT
How to read:
If the RSI , CCI or WT crosses above a programmed threshold and the other lines are also within a pre-defined buy range then the background will change to green for buy.
If the RSI , CCI or WT crosses below a programmed threshold and the other lines are also within a pre-defined sell range then the background will change to red for sell.
Where requirements are not met, the background is neither green nor red.
There are also red and green indicator x’s at the top/bottom of the indicator. They show a drastic change in Relative strength within a short period. This often indicates an immediate buy or sell opportunity.
Buy, Sell, Exit Buy and Exit Sell alerts are included.
Use the link below to obtain access to this indicator.
版本注释
Adapted the sell signal criteria to allow for sell entry when all lines remained beneath the zero line.仅限邀请脚本
只有作者授权的用户才能访问此脚本。您需要申请并获得使用许可。通常情况下,付款后即可获得许可。更多详情,请按照下方作者的说明操作,或直接联系VentureWealth。
TradingView不建议您付费购买或使用任何脚本,除非您完全信任其作者并了解其工作原理。您也可以在我们的社区脚本找到免费的开源替代方案。
作者的说明
免责声明
这些信息和出版物并非旨在提供,也不构成TradingView提供或认可的任何形式的财务、投资、交易或其他类型的建议或推荐。请阅读使用条款了解更多信息。
仅限邀请脚本
只有作者授权的用户才能访问此脚本。您需要申请并获得使用许可。通常情况下,付款后即可获得许可。更多详情,请按照下方作者的说明操作,或直接联系VentureWealth。
TradingView不建议您付费购买或使用任何脚本,除非您完全信任其作者并了解其工作原理。您也可以在我们的社区脚本找到免费的开源替代方案。
作者的说明
免责声明
这些信息和出版物并非旨在提供,也不构成TradingView提供或认可的任何形式的财务、投资、交易或其他类型的建议或推荐。请阅读使用条款了解更多信息。