OPEN-SOURCE SCRIPT
已更新 Rolling VWAP [QuantraSystems]
Rolling VWAP
Introduction
The Rolling VWAP (R͜͡oll-VWAP) indicator modernizes the traditional VWAP by recalculating continuously on a rolling window, making it adept at pinpointing market trends and breakout points.
Its dual functionality includes both the dynamic rolling VWAP and a customizable anchored VWAP, enhanced by color-coded visual cues, thereby offering traders valuable flexibility and insight for their market analysis.

Legend
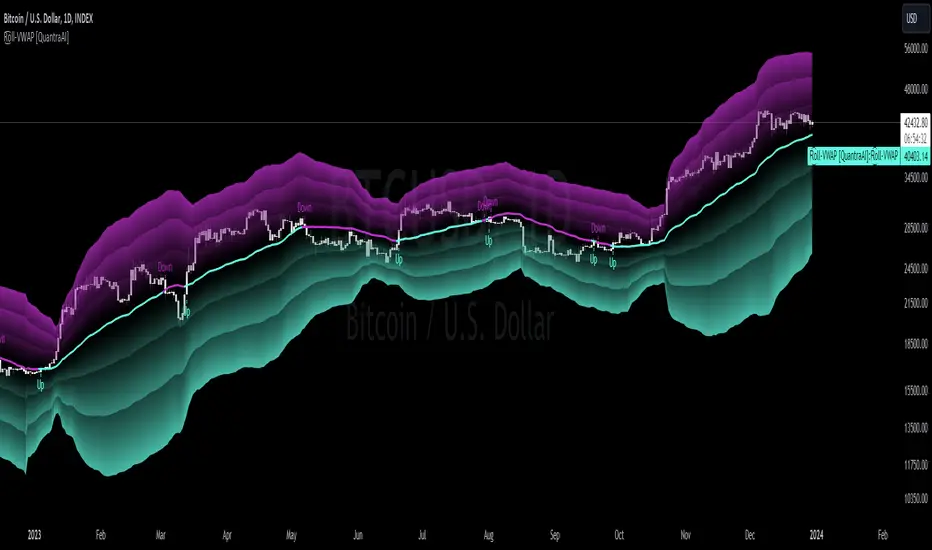
In the Image you can see the BTCUSD 1D Chart with the R͜͡oll-VWAP overlay.
You can see the individually activatable Standard Deviation (SD) Bands and the main VWAP Line.
It also features a Trend Signal which is deactivated by default and can be enabled if required.
Furthermore you can find the coloring of the VWAP line to represent the Trend.
In this case the trend itself is defined as:
Close being greater than the VWAP line -> Uptrend
Close below the VWAP line -> Downtrend
Notes
The R͜͡oll-VWAP can be used in a variety of ways.
Please note that we always advise to find more confluence by additional indicators.
Traders are encouraged to test and determine the most suitable settings for their specific trading strategies and timeframes.
Methodology
The R͜͡oll-VWAP is based on the inbuilt TV VWAP.
It expands upon the limitations of having an anchored timeframe and thus a limited data set that is being reset constantly.
Instead we have integrated a rolling nature that continuously calculates the VWAP over a customizable lookback.
To also keep the base utility it is possible to use the anchored timeframes as well.
Furthermore the visualization has been improved and we added the coloring of the main VWAP line according to the Trend as stated above.
The applicable Trend signals are also part of that.
The parameter settings and also the visualizations allow for ample customizations by the trader.
For questions or recommendations, please feel free to seek contact in the comments.
Introduction
The Rolling VWAP (R͜͡oll-VWAP) indicator modernizes the traditional VWAP by recalculating continuously on a rolling window, making it adept at pinpointing market trends and breakout points.
Its dual functionality includes both the dynamic rolling VWAP and a customizable anchored VWAP, enhanced by color-coded visual cues, thereby offering traders valuable flexibility and insight for their market analysis.
Legend
In the Image you can see the BTCUSD 1D Chart with the R͜͡oll-VWAP overlay.
You can see the individually activatable Standard Deviation (SD) Bands and the main VWAP Line.
It also features a Trend Signal which is deactivated by default and can be enabled if required.
Furthermore you can find the coloring of the VWAP line to represent the Trend.
In this case the trend itself is defined as:
Close being greater than the VWAP line -> Uptrend
Close below the VWAP line -> Downtrend
Notes
The R͜͡oll-VWAP can be used in a variety of ways.
- Volatility adjusted expected range
This aims to identify in which range the asset is likely to move - according to the historical values the SD Bands are calculated and thus their according probabilities displayed. - Trend analysis
Trending above or below the VWAP shows up or down trends accordingly. - S/R Levels
Based on the probability distribution the 2. SD often works as a Resistance level and either mid line or 1. SD lines can act as S/R levels - Unsustainable levels
Based on the probability distributions a SD level of beyond 2.5, especially 3 and higher is hit very seldom and highly unsustainable.
This can either mean a mean reversion state or a momentum slowdown is necessary to get back to a sustainable level.
Please note that we always advise to find more confluence by additional indicators.
Traders are encouraged to test and determine the most suitable settings for their specific trading strategies and timeframes.
Methodology
The R͜͡oll-VWAP is based on the inbuilt TV VWAP.
It expands upon the limitations of having an anchored timeframe and thus a limited data set that is being reset constantly.
Instead we have integrated a rolling nature that continuously calculates the VWAP over a customizable lookback.
To also keep the base utility it is possible to use the anchored timeframes as well.
Furthermore the visualization has been improved and we added the coloring of the main VWAP line according to the Trend as stated above.
The applicable Trend signals are also part of that.
The parameter settings and also the visualizations allow for ample customizations by the trader.
For questions or recommendations, please feel free to seek contact in the comments.
版本注释
Added custom alerts!Alerts are based upon the same logic as the trend signals found in the user menu.
版本注释
Added monochrome colors and the option for user-defined color themes.版本注释
Added the ability to remove the Deviation Band fill effect版本注释
Added 'Dynamic' capabilities.版本注释
Updated Dynamic Function Library.Updated header name tag.
版本注释
Updated License.License formatting shout out to RUBIX_BINARY
开源脚本
秉承TradingView的精神,该脚本的作者将其开源,以便交易者可以查看和验证其功能。向作者致敬!您可以免费使用该脚本,但请记住,重新发布代码须遵守我们的网站规则。
No statements or claims aim to be financial advice,
neither are any signals from us or our indicators.
Join the Cryptosystems Community (formerly QuantraSystems)👇
discord.gg/FMZDM3bZ9T
neither are any signals from us or our indicators.
Join the Cryptosystems Community (formerly QuantraSystems)👇
discord.gg/FMZDM3bZ9T
免责声明
这些信息和出版物并非旨在提供,也不构成TradingView提供或认可的任何形式的财务、投资、交易或其他类型的建议或推荐。请阅读使用条款了解更多信息。