INVITE-ONLY SCRIPT
PbF
What kind of traders/investors are we?
We are trend followers, always on the lookout for the next big move in the market. Our scripts are meticulously crafted for higher timeframes (daily, weekly, monthly) aiming to capture the large market trends.
What does the PbF script do?
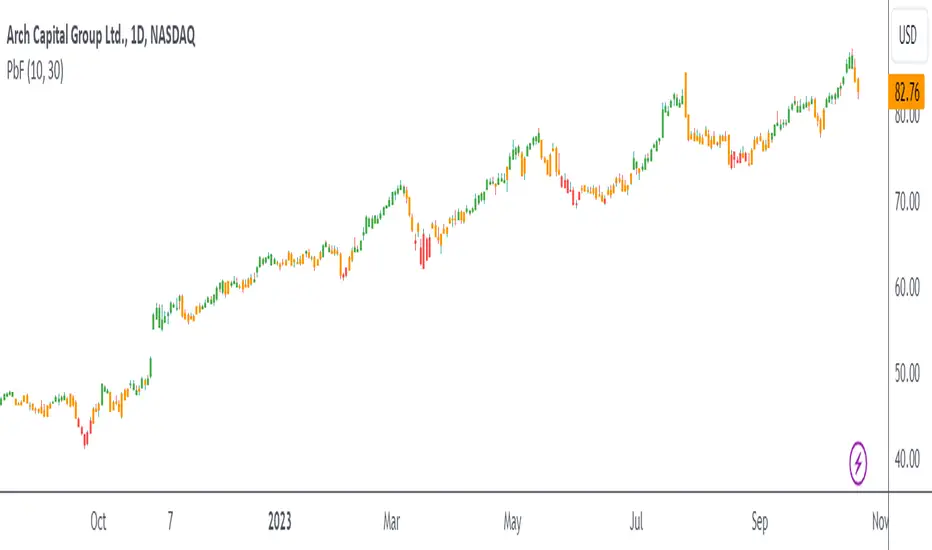
The PbF script simplifies the complex world of investing by colour-coding bars to indicate the trend direction. Green bars signify a bullish trend, red indicates a bearish trend, and orange is a precursor to potential pullback opportunities. This visual representation ensures investors can quickly gauge the market's direction and act accordingly.
How is the PbF produced?
The PbF script employs simple moving averages (SMA) as its backbone. Bars positioned above both the SMAs turn green, indicating a bullish trend. Conversely, bars below these SMAs turn red, signalling a bearish trend. When a bar oscillates between the SMAs, it turns orange, hinting at a potential pullback scenario.
What is the best timeframe to use the script?
The PbF script is designed for the weekly timeframe. By focusing on this timeframe, traders can pinpoint pullback positions, ensuring they are in sync with long-term market trends.
What makes the PbF script unique?
The challenges of identifying the onset, progression, and culmination of trends are well-known in the investing community. The PbF script addresses these challenges head-on.
First and foremost:
Designed explicitly for the weekly timeframe, the PbF also offers investors:
In essence, the PbF script is a trend filter that ensures investors remain aligned with long-term market trends, capitalising on pullbacks as the trend develops.
We are trend followers, always on the lookout for the next big move in the market. Our scripts are meticulously crafted for higher timeframes (daily, weekly, monthly) aiming to capture the large market trends.
What does the PbF script do?
The PbF script simplifies the complex world of investing by colour-coding bars to indicate the trend direction. Green bars signify a bullish trend, red indicates a bearish trend, and orange is a precursor to potential pullback opportunities. This visual representation ensures investors can quickly gauge the market's direction and act accordingly.
How is the PbF produced?
The PbF script employs simple moving averages (SMA) as its backbone. Bars positioned above both the SMAs turn green, indicating a bullish trend. Conversely, bars below these SMAs turn red, signalling a bearish trend. When a bar oscillates between the SMAs, it turns orange, hinting at a potential pullback scenario.
What is the best timeframe to use the script?
The PbF script is designed for the weekly timeframe. By focusing on this timeframe, traders can pinpoint pullback positions, ensuring they are in sync with long-term market trends.
What makes the PbF script unique?
The challenges of identifying the onset, progression, and culmination of trends are well-known in the investing community. The PbF script addresses these challenges head-on.
First and foremost:
- The PbF remains orange during extended periods of pullbacks and will only change colour when the pullback has ended.
- The filter also highlights an earlier entry from the previous bar if the market continues to pull back against the long-term trend, allowing you to adjust your entry as required.
Designed explicitly for the weekly timeframe, the PbF also offers investors:
- A clear roadmap to discern the beginning, middle, and end of market trends.
- The flexibility to exercise discretion when entering pullback positions.
In essence, the PbF script is a trend filter that ensures investors remain aligned with long-term market trends, capitalising on pullbacks as the trend develops.
仅限邀请脚本
只有作者授权的用户才能访问此脚本。您需要申请并获得使用许可。通常情况下,付款后即可获得许可。更多详情,请按照下方作者的说明操作,或直接联系Sublime_Trading。
TradingView不建议您付费购买或使用任何脚本,除非您完全信任其作者并了解其工作原理。您也可以在我们的社区脚本找到免费的开源替代方案。
作者的说明
This is a tool for Sublime Trading community members only. If you DM us your email, we will send you details on joining the community.
Join Our Private Community
bit.ly/join-ST-community
Plus Get Our Ultimate Stock Market Blueprint.
bit.ly/join-ST-community
Plus Get Our Ultimate Stock Market Blueprint.
免责声明
这些信息和出版物并非旨在提供,也不构成TradingView提供或认可的任何形式的财务、投资、交易或其他类型的建议或推荐。请阅读使用条款了解更多信息。