OPEN-SOURCE SCRIPT
Auto Gann KEYLVLS
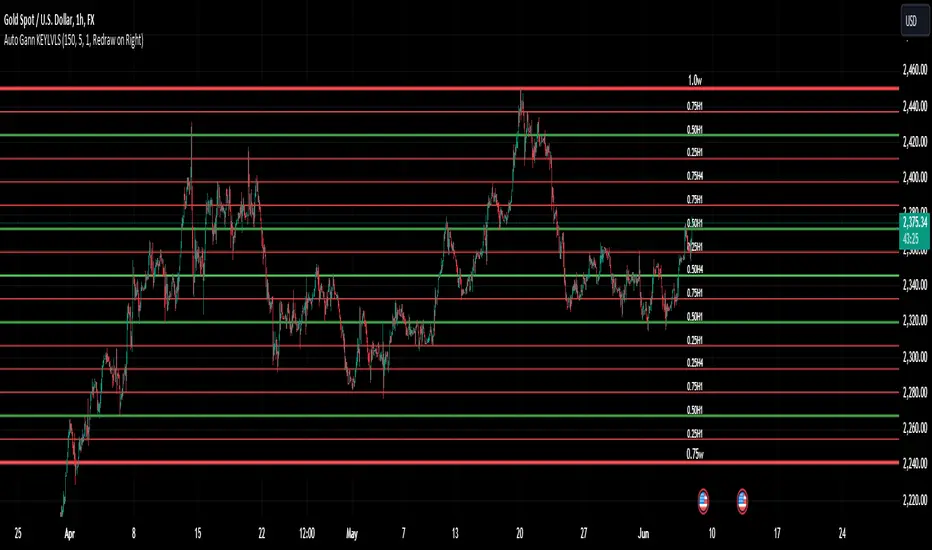
"Auto Gann KEYLVLS" indicator can be a valuable tool for traders, especially those who employ Gann theory in their analysis. Here are some ways to effectively use this indicator:
Identifying Key Price Levels: Gann lines are known for their ability to identify key support and resistance levels. Use the plotted Gann lines to identify significant price levels where the market may react.
Confirmation of Trend Reversals: When price approaches a Gann line, observe how the price reacts. A bounce off a Gann line can confirm the continuation of the trend, while a break of a Gann line may indicate a potential trend reversal.
Entry and Exit Points: Gann lines can serve as entry and exit points for trades. Look for confluence between Gann lines and other technical indicators or patterns to identify high-probability trade setups.
Trading with the Trend: In an uptrend, consider buying opportunities near Gann support levels, while in a downtrend, look for selling opportunities near Gann resistance levels.
Risk Management: Use Gann lines to set stop-loss and take-profit levels. Place stop-loss orders below Gann support levels for long trades and above Gann resistance levels for short trades to manage risk effectively.
Timeframe Analysis: Utilize the flexibility of this indicator to plot Gann lines on different timeframes. Compare Gann lines across multiple timeframes to identify alignment or divergence, which can provide additional confirmation for trading decisions.
Combination with Other Indicators: Combine the information provided by Gann lines with other technical indicators, such as moving averages, RSI, or MACD, to strengthen your trading decisions.
Input Parameters:
The script defines several input parameters that control the behavior of the Gann lines, such as the number of weeks to look back for highs and lows, the number of Gann lines to plot, line extension settings, and options to show or hide specific Gann lines like .25, .37, .50, .63, and .75.
Auto Gann Functionality:
The script calculates the highest high and lowest low for the specified number of weeks, hours, and minutes.
It then calculates quartile levels (0.25, 0.50, 0.75) based on the weekly high and low.
Gann lines are drawn based on these levels, with options to extend them left and/or right.
Labels are added to the Gann lines indicating their values.
Weekly Gann Lines:
The script plots Gann lines and labels based on the weekly high and low levels.
Labels are added to these lines indicating their values.
Sub Gann Lines:
Additional Gann lines are plotted based on the weekly high and low levels, with subdivisions for lower timeframes like H4, H1, M15, and M1.
Label Management:
Labels are managed based on user preferences, including options to show labels once on the left side, redraw labels on the right side, or not show labels at all.
开源脚本
秉承TradingView的精神,该脚本的作者将其开源,以便交易者可以查看和验证其功能。向作者致敬!您可以免费使用该脚本,但请记住,重新发布代码须遵守我们的网站规则。
免责声明
这些信息和出版物并非旨在提供,也不构成TradingView提供或认可的任何形式的财务、投资、交易或其他类型的建议或推荐。请阅读使用条款了解更多信息。
开源脚本
秉承TradingView的精神,该脚本的作者将其开源,以便交易者可以查看和验证其功能。向作者致敬!您可以免费使用该脚本,但请记住,重新发布代码须遵守我们的网站规则。
免责声明
这些信息和出版物并非旨在提供,也不构成TradingView提供或认可的任何形式的财务、投资、交易或其他类型的建议或推荐。请阅读使用条款了解更多信息。