INVITE-ONLY SCRIPT
已更新 Ultimate Buy&Sell Cycles
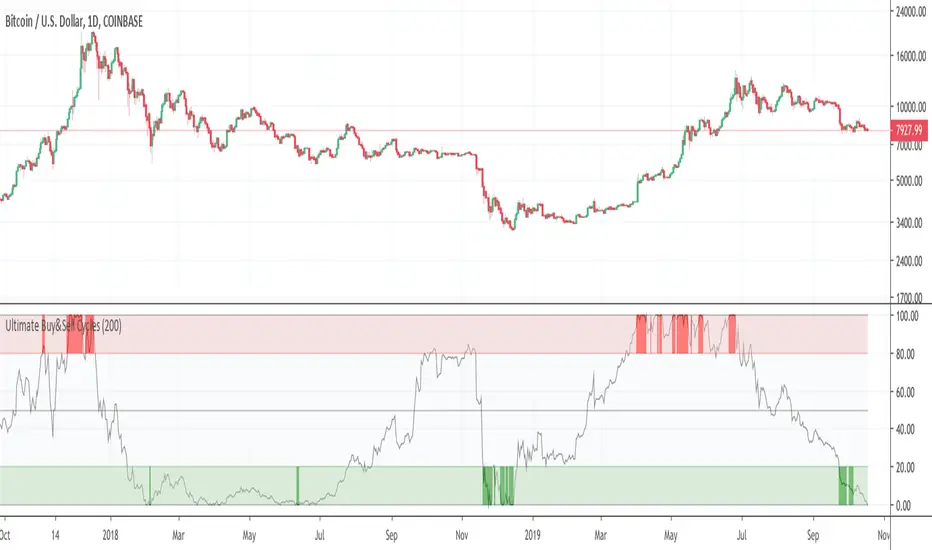
This indictor shows potential buy and sell zones of any asset.
版本注释
Improvements版本注释
This Indicator helps to invest midterm / longterm. It shows possible levels for accumulation and selling.The accumulation phase is when the indicator is in the green (buy) zone. The opposite is the red (sell) zone.
Important:
This are not signals to buy or sell. This indicator should just help you by making your own decision.
This indicator works on nearly every asset (crypto, stocks, …). You shuld use it on a daily base.
版本注释
Example Bitcoin Chart:Example Gold Chart:
版本注释
Improvements.版本注释
Corrections.版本注释
.版本注释
Corrections.仅限邀请脚本
只有经作者批准的用户才能访问此脚本。您需要申请并获得使用权限。该权限通常在付款后授予。如需了解更多详情,请按照以下作者的说明操作,或直接联系CryptoAndy。
除非您完全信任其作者并了解脚本的工作原理,否則TradingView不建议您付费或使用脚本。您还可以在我们的社区脚本中找到免费的开源替代方案。
作者的说明
❓❓ You want to use this Indicator? ❓❓
💲 Buy here: bit.ly/2OTpujA
💲 Buy here: bit.ly/2OTpujA
免责声明
这些信息和出版物并不意味着也不构成TradingView提供或认可的金融、投资、交易或其它类型的建议或背书。请在使用条款阅读更多信息。
仅限邀请脚本
只有经作者批准的用户才能访问此脚本。您需要申请并获得使用权限。该权限通常在付款后授予。如需了解更多详情,请按照以下作者的说明操作,或直接联系CryptoAndy。
除非您完全信任其作者并了解脚本的工作原理,否則TradingView不建议您付费或使用脚本。您还可以在我们的社区脚本中找到免费的开源替代方案。
作者的说明
❓❓ You want to use this Indicator? ❓❓
💲 Buy here: bit.ly/2OTpujA
💲 Buy here: bit.ly/2OTpujA
免责声明
这些信息和出版物并不意味着也不构成TradingView提供或认可的金融、投资、交易或其它类型的建议或背书。请在使用条款阅读更多信息。