OPEN-SOURCE SCRIPT
已更新 MACD Dashboard
The MACD Dashboard is an addition to my collection of various dashboards that are designed to help traders make wiser decisions.
How to Use MACD Dashboard:
How to Use MACD Dashboard:
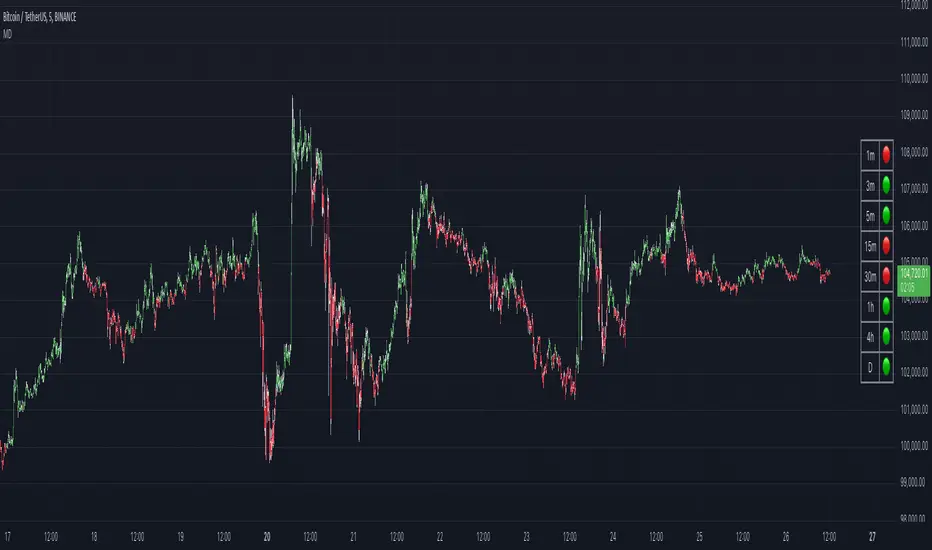
- Timeframe Selection: Based on your trading style and preferences, choose the relevant timeframes. In the settings, enable or disable timeframes to focus on the most relevant ones for your strategy.
- Dashboard Interpretation: The MACD Dashboard displays green (🟢) and red (🔴) symbols to indicate when the MACD is in green or in the red zone. You can also leverage the MACD values on the dashboard to better interpret sentiment and its changes.
- Confirmation and Strategy: Consider MACD Dashboard signals as confirmation for your trading strategy. For instance, in an uptrend, look for long opportunities when the dashboard displays consistent green symbols. Conversely, in a downtrend, focus on short opportunities when red symbols dominate.
- Risk Management: As with any indicator, use the MACD Dashboard in conjunction with proper risk management techniques. Avoid trading solely based on indicator signals; instead, integrate them into a comprehensive trading plan.
版本注释
🏎️ Improved performance: Optimized the indicator’s calculations for faster loading and smoother experience.🐛 Bug fix: Resolved an issue where the indicator did not display on instruments that don’t support intraday timeframes.
版本注释
🛠️ Revert the change related to intraday timeframes. Turned out it's a limitation of TradingView that cannot be bypassed, and my workaround broke the intraday on some other funds, such as leveraged assets.开源脚本
秉承TradingView的精神,该脚本的作者将其开源,以便交易者可以查看和验证其功能。向作者致敬!您可以免费使用该脚本,但请记住,重新发布代码须遵守我们的网站规则。
免责声明
这些信息和出版物并非旨在提供,也不构成TradingView提供或认可的任何形式的财务、投资、交易或其他类型的建议或推荐。请阅读使用条款了解更多信息。
免责声明
这些信息和出版物并非旨在提供,也不构成TradingView提供或认可的任何形式的财务、投资、交易或其他类型的建议或推荐。请阅读使用条款了解更多信息。