INVITE-ONLY SCRIPT
已更新 Quantura - Quantified Price Action Strategy
Introduction
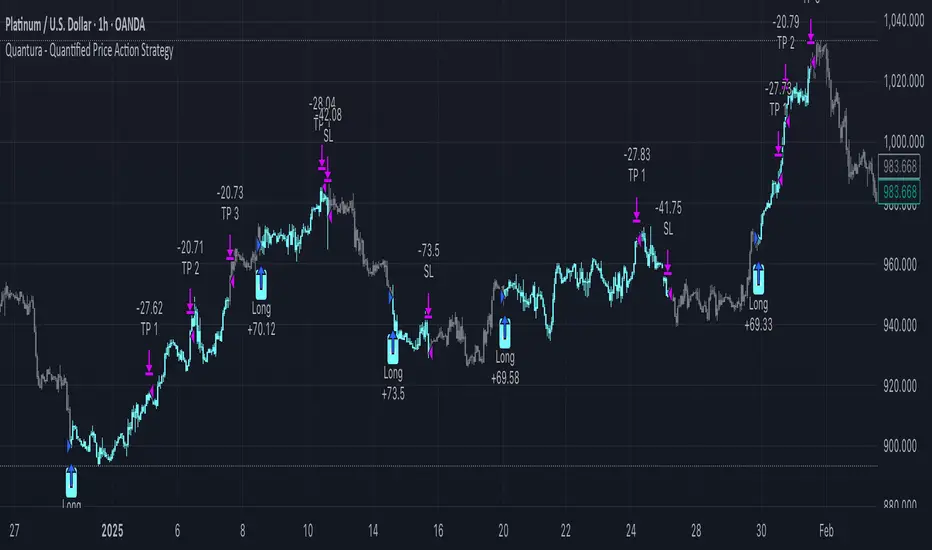
“Quantura – Quantified Price Action Strategy” is an invite-only Pine Script strategy designed to combine multiple price action concepts into a single trading framework. It integrates supply and demand zones, liquidity sweeps and runs, fair value gaps (FVGs), RSI filters, and EMA trend confirmation. The strategy also provides a visual overlay with dynamic trend-colored candles for easier chart interpretation. It is intended for multi-market use across cryptocurrencies, Forex, equities, and indices.
Originality & Value
The strategy is original in how it unifies several institutional-style price action elements and validates trades only when they align. This reduces noise compared to using single indicators in isolation. Its unique value lies in the combination of:
This layered confluence approach ensures that entries are not taken on a single condition but require agreement across several dimensions of market structure, momentum, and order flow.
Functionality & Indicators
Parameters & Customization
Default Properties (Strategy Settings)
Note: The default of 100% equity per trade is used for testing purposes only and would not be sustainable in real trading. A typical allocation in practice would be between 1–5% of account equity per trade, sometimes up to 10%.
Backtesting & Performance
Backtests on XPTUSD over 2.5 years with the default settings produced:
These results show how the confluence of supply/demand, liquidity, and RSI filters can produce robust setups. However, past performance does not guarantee future results. While the trade count (129) is sufficient for statistical analysis, results may vary across markets and timeframes.
Risk Management
This framework allows both conservative and aggressive configurations, depending on user preference.
Limitations & Market Conditions
Usage Guide
Author & Access
Developed 100% by Quantura. Published as an Invite-Only script. Access is available upon request via the Author’s Instructions field.
Important
This description complies with TradingView’s publishing rules. It clarifies originality, explains the underlying logic, discloses default properties, and presents backtest results with realistic disclaimers.
“Quantura – Quantified Price Action Strategy” is an invite-only Pine Script strategy designed to combine multiple price action concepts into a single trading framework. It integrates supply and demand zones, liquidity sweeps and runs, fair value gaps (FVGs), RSI filters, and EMA trend confirmation. The strategy also provides a visual overlay with dynamic trend-colored candles for easier chart interpretation. It is intended for multi-market use across cryptocurrencies, Forex, equities, and indices.
Originality & Value
The strategy is original in how it unifies several institutional-style price action elements and validates trades only when they align. This reduces noise compared to using single indicators in isolation. Its unique value lies in the combination of:
- Supply & Demand detection: Dynamic boxes identified through pivots, ATR, and volume sensitivity.
- Liquidity sweeps and runs: Detects when swing highs/lows are broken and retested, distinguishing between liquidity grabs (sweeps) and directional runs.
- RSI filter: Can be set to normal or aggressive, confirming momentum before trades.
- Fair Value Gaps (FVGs): Optional detection and filtering of price inefficiencies.
- EMA filter: Aligns trades with the broader market trend.
- Trend candle visualization: Candles dynamically colored bullish, bearish, or neutral, based on strategy positions.
This layered confluence approach ensures that entries are not taken on a single condition but require agreement across several dimensions of market structure, momentum, and order flow.
Functionality & Indicators
- Supply & Demand Zones: Zones are created when pivots, ATR sensitivity, and volume thresholds overlap.
- Liquidity: Swing highs and lows are tracked, with options for sweep (fakeout/reversal) or run (continuation) detection.
- RSI: Confirms long signals when oversold and shorts when overbought, with configurable aggressiveness.
- FVG filter: Adds validation by requiring price interaction with inefficiency zones.
- EMA filter: Ensures longs are above EMA and shorts below EMA.
- Signals & Visualization: Trade entries are marked on the chart, while candles change color to reflect trade direction and status.
Parameters & Customization
- Supply & Demand: Sensitivity (swing range, volume multiplier, ATR multiplier) and display options.
- Liquidity filter: Mode (Run or Sweep), display, and swing length.
- RSI: Enable/disable, length, and style (normal or aggressive).
- Fair Value Gaps: Sensitivity via ATR factor, optional volume filter, and display toggles.
- EMA: Length, enable/disable, and visualization.
- Risk management: Up to three configurable take-profit levels, stop-loss, break-even logic, and capital-based position sizing.
- Visualization: Custom candle coloring and optional overlay for better clarity.
Default Properties (Strategy Settings)
- Initial Capital: 10,000 USD
- Position Size: 100% of equity per trade (backtest default)
- Commission: 0.1%
- Slippage: 1
- Pyramiding: 0 (only one position at a time)
Note: The default of 100% equity per trade is used for testing purposes only and would not be sustainable in real trading. A typical allocation in practice would be between 1–5% of account equity per trade, sometimes up to 10%.
Backtesting & Performance
Backtests on XPTUSD over 2.5 years with the default settings produced:
- 129 trades
- 73.64% win rate
- Profit factor: 2.6
- Maximum drawdown: 18.2%
These results show how the confluence of supply/demand, liquidity, and RSI filters can produce robust setups. However, past performance does not guarantee future results. While the trade count (129) is sufficient for statistical analysis, results may vary across markets and timeframes.
Risk Management
- Three configurable take-profit levels with percentage allocation.
- Initial stop-loss based on user-defined percentage.
- Dynamic stop-loss that adjusts with market movement.
- Break-even logic that shifts stops to entry after predefined gains.
- Position sizing based on risk percentage of equity.
This framework allows both conservative and aggressive configurations, depending on user preference.
Limitations & Market Conditions
- Works best in volatile and liquid markets such as crypto, metals, indices, and FX.
- May produce false signals in low-volume or sideways environments.
- Unexpected news or macro events can override technical conditions.
- Default position sizing of 100% equity is highly aggressive and should be reduced before any practical use.
Usage Guide
- Add “Quantura – Quantified Price Action Strategy” to your chart.
- Select Supply & Demand, Liquidity, RSI, EMA, and FVG settings according to your market and timeframe.
- Configure risk management: take-profits, stop-loss, and risk-per-trade percentage.
- Use the Strategy Tester to analyze statistics, equity curve, and performance under different conditions.
- Optimize parameters before applying the strategy to different markets.
Author & Access
Developed 100% by Quantura. Published as an Invite-Only script. Access is available upon request via the Author’s Instructions field.
Important
This description complies with TradingView’s publishing rules. It clarifies originality, explains the underlying logic, discloses default properties, and presents backtest results with realistic disclaimers.
版本注释
- Improved Supply & Demand Calculation
- Updated Liquidity Levels
- Rebuilt RSI Logic
- Fixed Candle Coloring Bug
仅限邀请脚本
只有经作者批准的用户才能访问此脚本。您需要申请并获得使用权限。该权限通常在付款后授予。如需了解更多详情,请按照以下作者的说明操作,或直接联系Quantura。
除非您完全信任其作者并了解脚本的工作原理,否則TradingView不建议您付费或使用脚本。您还可以在我们的社区脚本中找到免费的开源替代方案。
作者的说明
Get instant access at https://www.quantura.io/
Get instant access at quantura.io/
免责声明
这些信息和出版物并不意味着也不构成TradingView提供或认可的金融、投资、交易或其它类型的建议或背书。请在使用条款阅读更多信息。