INVITE-ONLY SCRIPT
已更新 VB Resistance Support
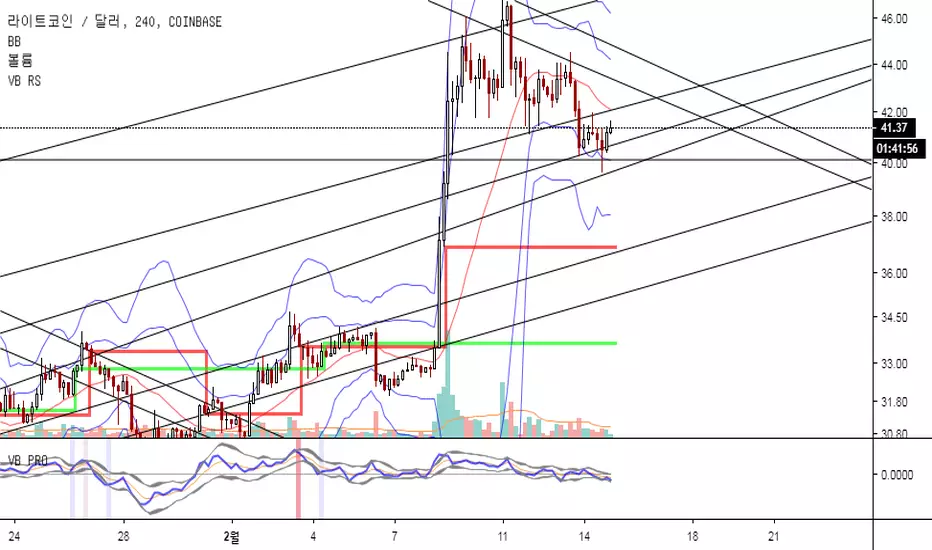
The VB RS indicator will plot dot lines that represent the swing points based on the swing length input(number of bars to the left and right of the swing point).
Swing highs and lows can be used by traders to identify possible areas of support and resistance , which can then be used to determine optimal positions for stop-loss or profit target orders.
highs and lows are earlier market turning points. Hence, they are natural choices for projecting support and resistance levels. Every point is a potential support or resistance level . However, for effective trading, focus on major swing highs and lows.
This indicator was created based on VB Indicator.
版本注释
Resistance & Support line style editcircles -> linebar
版本注释
add functionview background RED, GREEN, BLUE
版本注释
add new functioncan check cloud like Ichimoku Cloud.
版本注释
update版本注释
update免责声明
这些信息和出版物并非旨在提供,也不构成TradingView提供或认可的任何形式的财务、投资、交易或其他类型的建议或推荐。请阅读使用条款了解更多信息。