OPEN-SOURCE SCRIPT
EMA Cross Counter
EMA Cross Counter – Trend & Crossover Analyzer
🔥 Description
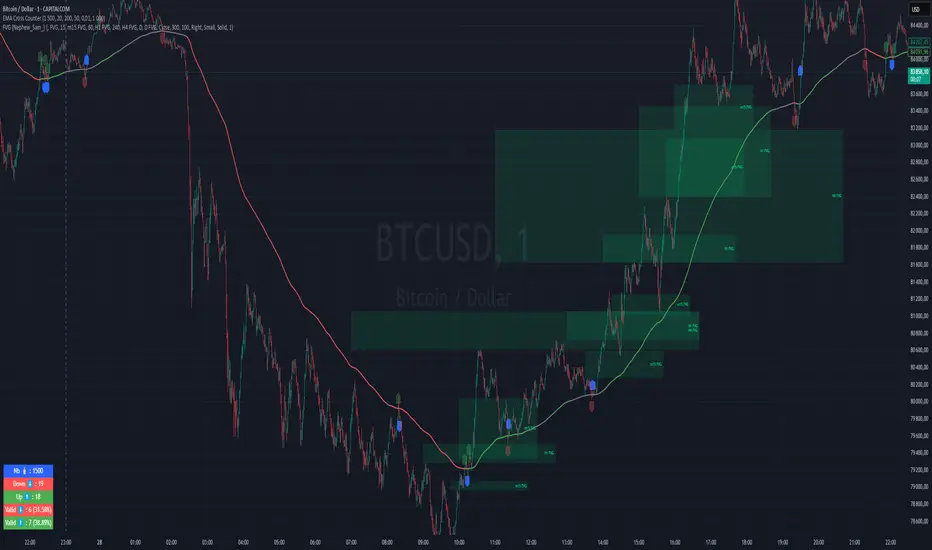
The EMA Cross Counter is an advanced indicator designed to detect price crossovers with the EMA 200 and provide insightful trend analysis. It highlights valid signals and displays success statistics directly on the chart.
🎯 Key Features
✅ Crossover Detection: Identifies moments when the price crosses the EMA 200 upward or downward.
✅ Signal Filtering: Valid signals (leading to sustained trends) are shown in blue, while invalid signals are faded.
✅ Performance Analysis: A statistics table shows the number of crossovers and their success rate.
✅ Dynamic EMA Coloring:
🟢 Green when the trend is bullish
🔴 Red when the trend is bearish
⚪ Gray when the market is in a range
✅ Range Detection: If the price remains within a narrow range for 30 candles, the EMA turns gray to indicate trend uncertainty.
✅ Stop-Loss (SL) Display: A dashed red line appears below sell signals and above buy signals (adjustable in pips).
✅ Automatic Alerts: Get notified when a significant crossover occurs.
📈 How to Use It?
1️⃣ Look for blue signals as potential trade entries.
2️⃣ Avoid trading when the EMA is gray (ranging market).
3️⃣ Use success rate statistics to evaluate crossover reliability.
4️⃣ Adjust SL distance in the settings to match your risk management strategy.
🛠 Customization Options
Adjustable EMA period
Configurable range threshold
SL distance customizable in pips
Enable/Disable alerts
💡 Ideal for scalping and swing trading, this indicator offers clear trend insights to enhance your decision-making process!
💬 Try it out and share your feedback! 🚀
🔥 Description
The EMA Cross Counter is an advanced indicator designed to detect price crossovers with the EMA 200 and provide insightful trend analysis. It highlights valid signals and displays success statistics directly on the chart.
🎯 Key Features
✅ Crossover Detection: Identifies moments when the price crosses the EMA 200 upward or downward.
✅ Signal Filtering: Valid signals (leading to sustained trends) are shown in blue, while invalid signals are faded.
✅ Performance Analysis: A statistics table shows the number of crossovers and their success rate.
✅ Dynamic EMA Coloring:
🟢 Green when the trend is bullish
🔴 Red when the trend is bearish
⚪ Gray when the market is in a range
✅ Range Detection: If the price remains within a narrow range for 30 candles, the EMA turns gray to indicate trend uncertainty.
✅ Stop-Loss (SL) Display: A dashed red line appears below sell signals and above buy signals (adjustable in pips).
✅ Automatic Alerts: Get notified when a significant crossover occurs.
📈 How to Use It?
1️⃣ Look for blue signals as potential trade entries.
2️⃣ Avoid trading when the EMA is gray (ranging market).
3️⃣ Use success rate statistics to evaluate crossover reliability.
4️⃣ Adjust SL distance in the settings to match your risk management strategy.
🛠 Customization Options
Adjustable EMA period
Configurable range threshold
SL distance customizable in pips
Enable/Disable alerts
💡 Ideal for scalping and swing trading, this indicator offers clear trend insights to enhance your decision-making process!
💬 Try it out and share your feedback! 🚀
开源脚本
秉承TradingView的精神,该脚本的作者将其开源,以便交易者可以查看和验证其功能。向作者致敬!您可以免费使用该脚本,但请记住,重新发布代码须遵守我们的网站规则。
免责声明
这些信息和出版物并非旨在提供,也不构成TradingView提供或认可的任何形式的财务、投资、交易或其他类型的建议或推荐。请阅读使用条款了解更多信息。
开源脚本
秉承TradingView的精神,该脚本的作者将其开源,以便交易者可以查看和验证其功能。向作者致敬!您可以免费使用该脚本,但请记住,重新发布代码须遵守我们的网站规则。
免责声明
这些信息和出版物并非旨在提供,也不构成TradingView提供或认可的任何形式的财务、投资、交易或其他类型的建议或推荐。请阅读使用条款了解更多信息。