OPEN-SOURCE SCRIPT
dashboard MTF,EMA

User Guide: Dashboard MTF EMA
Script Installation:
Copy the script code.
Go to the script window (Pine Editor) on TradingView.
Paste the code into the script window.
Save the script.
Adding the Script to the Chart:
Return to your chart on TradingView.
Look for the script in the list of available scripts.
Add the script to the chart.
Interpreting the Table:
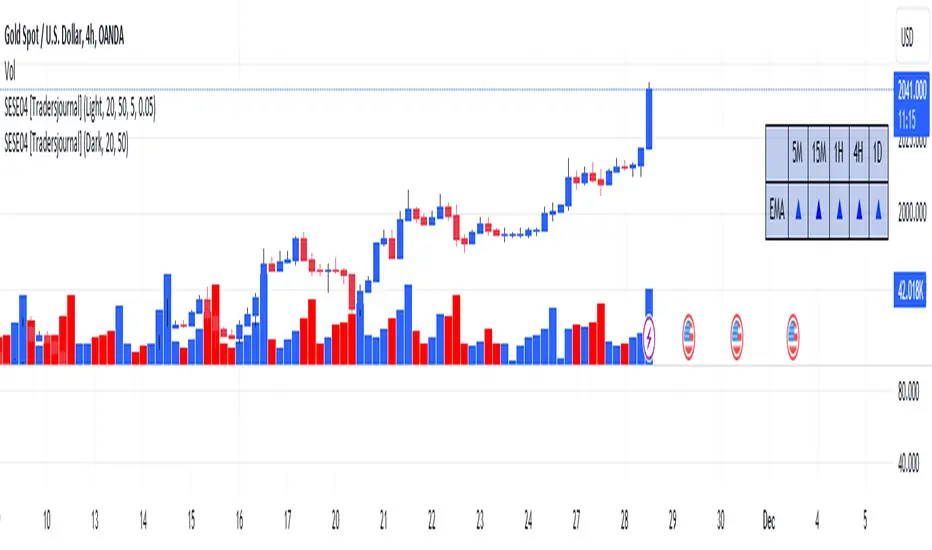
On the right side of the chart, you will see a table labeled "EMA" with arrows.
The rows correspond to different timeframes: 5 minutes (5M), 15 minutes (15M), 1 hour (1H), 4 hours (4H), and 1 day (1D).
Understanding the Arrows:
Each row of the table has two columns: "EMA" and an arrow.
"EMA" indicates the trend of the Exponential Moving Average (EMA) for the specified period.
The arrow indicates the direction of the trend: ▲ for bullish, ▼ for bearish.
Table Colors:
The colors of the table reflect the current trend based on the comparison between fast and slow EMAs.
Blue (▲) indicates a bullish trend.
Red (▼) indicates a bearish trend.
Table Theme:
The table has a dark (Dark) or light (Light) theme according to your preference.
The background, frame, and colors are adjusted based on the selected theme.
Usage:
Use the table as a quick indicator of trends on different timeframes.
The arrows help you quickly identify trends without navigating between different time units.
Designed to simplify analysis and avoid cluttering the chart with multiple indicators.
开源脚本
秉承TradingView的精神,该脚本的作者将其开源,以便交易者可以查看和验证其功能。向作者致敬!您可以免费使用该脚本,但请记住,重新发布代码须遵守我们的网站规则。
免责声明
这些信息和出版物并非旨在提供,也不构成TradingView提供或认可的任何形式的财务、投资、交易或其他类型的建议或推荐。请阅读使用条款了解更多信息。
开源脚本
秉承TradingView的精神,该脚本的作者将其开源,以便交易者可以查看和验证其功能。向作者致敬!您可以免费使用该脚本,但请记住,重新发布代码须遵守我们的网站规则。
免责声明
这些信息和出版物并非旨在提供,也不构成TradingView提供或认可的任何形式的财务、投资、交易或其他类型的建议或推荐。请阅读使用条款了解更多信息。