OPEN-SOURCE SCRIPT
已更新 Arego ATR
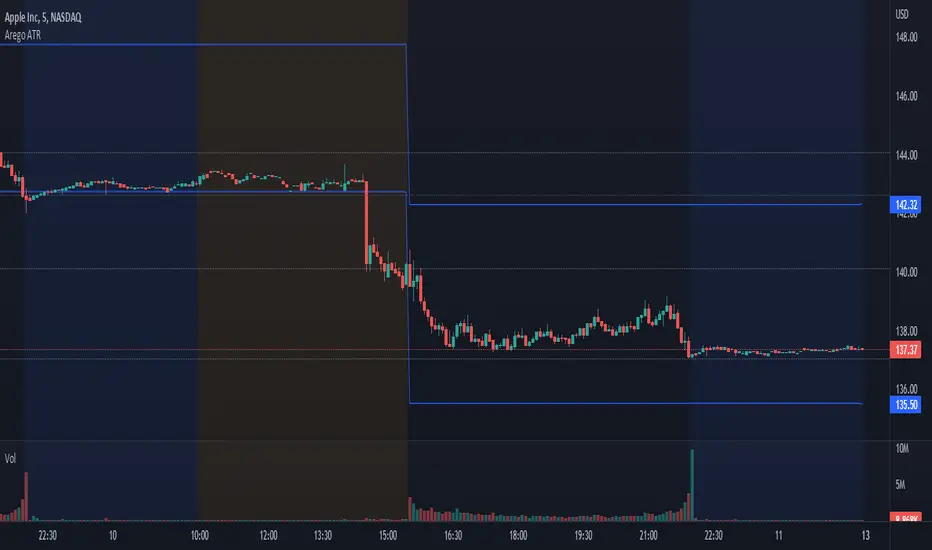
This script automatically calculates ATR on a daily basis where it would be highest and lowest and draws a line there.
With this you can see whether stock has passed the ATR or not.
When stock moves, line is adjusted as well. For example, the stock opened at $100 and moved down $1.
ATR is $5.
Script will then draw two lines on the chart.
Daily low ATR would then be $95 and daily high ATR would then be $104.
The formula is very simple:
Current price + ATR = daily high
Current price - ATR = daily low
版本注释
I corrected my misconceptions in script logic.开源脚本
秉承TradingView的精神,该脚本的作者将其开源,以便交易者可以查看和验证其功能。向作者致敬!您可以免费使用该脚本,但请记住,重新发布代码须遵守我们的网站规则。
免责声明
这些信息和出版物并非旨在提供,也不构成TradingView提供或认可的任何形式的财务、投资、交易或其他类型的建议或推荐。请阅读使用条款了解更多信息。
免责声明
这些信息和出版物并非旨在提供,也不构成TradingView提供或认可的任何形式的财务、投资、交易或其他类型的建议或推荐。请阅读使用条款了解更多信息。