OPEN-SOURCE SCRIPT
Depth Trend Indicator - RSI
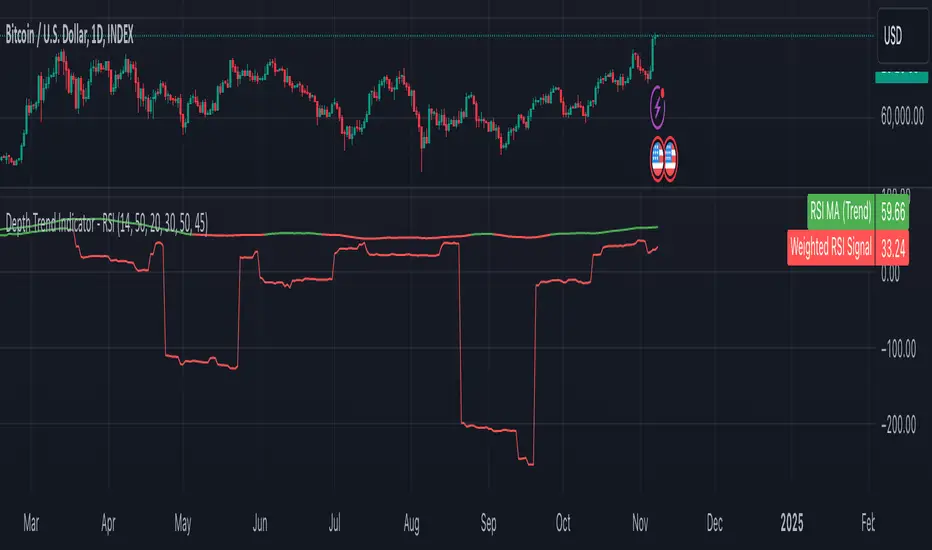
Depth Trend Indicator - RSI
This indicator is designed to identify trends and gauge pullback strength by combining the power of RSI and moving averages with a depth-weighted calculation. The script was created by me, Nathan Farmer and is based on a multi-step process to determine trend strength and direction, adjusted by a "depth" factor for more accurate signal analysis.
How It Works
Key Parameters
Notes:
As always, backtest this indicator and modify the parameters as needed for your specific asset, over your specific timeframe. I chose these defaults as they worked well on the assets I look at, but it is likely you tend to look at a different group of assets over a different timeframe than what I do.
Large pullbacks can create large downward spikes in the weighted line. This isn't graphically pleasing, but I have tested it with various methods of normalization and smoothing and found the simple smoothing used in the indicator to be best despite this.
This indicator is designed to identify trends and gauge pullback strength by combining the power of RSI and moving averages with a depth-weighted calculation. The script was created by me, Nathan Farmer and is based on a multi-step process to determine trend strength and direction, adjusted by a "depth" factor for more accurate signal analysis.
How It Works
- Trend Definition Using RSI: The RSI Moving Average (rsiMa) is calculated to assess the current trend, using customizable parameters for the RSI Period and MA Period.
- Trends are defined as follows:
Uptrend: RSI MA > Critical RSI Value
Downtrend: RSI MA < Critical RSI Value - Pullback Depth Calculation: To measure pullback strength relative to the current trend, the indicator calculates a Depth Percentage. This is defined as the portion of the gap between the moving average and the price covered by a pullback.
- Depth-Weighted RSI Calculation: The Depth Percentage is then applied as a weighting factor on the RSI Moving Average, giving us a Weighted RSI line that adjusts to the depth of pullbacks. This line is rather noisy, and as such we take a moving average to smooth out some of the noise.
Key Parameters
- RSI Period: The period for RSI calculation.
- MA Period: The moving average period applied to RSI.
- Price MA Period: Determines the SMA period for price, used to calculate pullback depth.
- Smoothing Length: Length of smoothing applied to the weighted RSI, creating a more stable signal.
- RSI Critical Value: The critical value (level) used in determining whether we're in an uptrend or a downtrend.
- Depth Critical Value: The critical value (level) used in determining whether or not the depth weighted value confirms the state of a trend.
Notes:
As always, backtest this indicator and modify the parameters as needed for your specific asset, over your specific timeframe. I chose these defaults as they worked well on the assets I look at, but it is likely you tend to look at a different group of assets over a different timeframe than what I do.
Large pullbacks can create large downward spikes in the weighted line. This isn't graphically pleasing, but I have tested it with various methods of normalization and smoothing and found the simple smoothing used in the indicator to be best despite this.
开源脚本
秉承TradingView的精神,该脚本的作者将其开源,以便交易者可以查看和验证其功能。向作者致敬!您可以免费使用该脚本,但请记住,重新发布代码须遵守我们的网站规则。
免责声明
这些信息和出版物并非旨在提供,也不构成TradingView提供或认可的任何形式的财务、投资、交易或其他类型的建议或推荐。请阅读使用条款了解更多信息。
开源脚本
秉承TradingView的精神,该脚本的作者将其开源,以便交易者可以查看和验证其功能。向作者致敬!您可以免费使用该脚本,但请记住,重新发布代码须遵守我们的网站规则。
免责声明
这些信息和出版物并非旨在提供,也不构成TradingView提供或认可的任何形式的财务、投资、交易或其他类型的建议或推荐。请阅读使用条款了解更多信息。