OPEN-SOURCE SCRIPT
已更新 Panic Drop Bitcoin 5 EMA Buy & Sell Signal
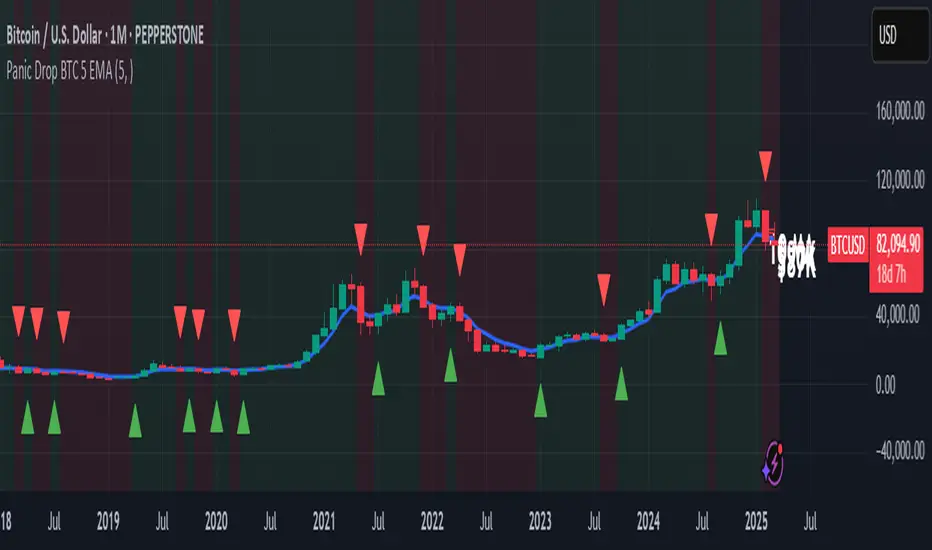
Panic Drop BTC 5 EMA
What It Does:
This indicator tracks Bitcoin’s price against a 5-period Exponential Moving Average (EMA) to deliver simple buy and sell signals. A green arrow below the candle signals a buy when Bitcoin closes above the 5-EMA, while a red arrow above signals a sell when it closes below. Perfect for spotting Bitcoin’s momentum shifts—whether you’re a newbie, crypto trader, or short on time.
Key Features:
Plots a customizable 5-EMA (default: blue line).
Buy () and Sell () signals on crossovers/crossunders.
Optional background highlight: green (above EMA), red (below).
Alerts for buy/sell triggers.
Fully adjustable: timeframe, colors, signal toggles.
How to Use It:
Add to your BTC/USD chart (works on any timeframe—daily default recommended).
Watch for green arrows (buy) below candles and red arrows (sell) above.
Customize via settings:
Adjust EMA period (default: 5).
Set timeframe (e.g., "D" for daily, "1H" for hourly).
Change colors or toggle signals/background off.
Set alerts: Right-click a signal > "Add Alert" > Select "Buy Signal" or "Sell Signal."
Trade smart: Use signals to catch Bitcoin dips (e.g., buy below $100K) or exits.
Why It’s Great:
Beginners: Clear arrows simplify decisions.
Crypto Traders: 5-EMA catches Bitcoin’s fast moves.
Busy Investors: Signals save time—no deep analysis needed.
Created by Timothy Assi (Panic Drop), eToro’s elite investor. Test it, tweak it, and trade with confidence!
版本注释
TEST开源脚本
秉承TradingView的精神,该脚本的作者将其开源,以便交易者可以查看和验证其功能。向作者致敬!您可以免费使用该脚本,但请记住,重新发布代码须遵守我们的网站规则。
免责声明
这些信息和出版物并非旨在提供,也不构成TradingView提供或认可的任何形式的财务、投资、交易或其他类型的建议或推荐。请阅读使用条款了解更多信息。
开源脚本
秉承TradingView的精神,该脚本的作者将其开源,以便交易者可以查看和验证其功能。向作者致敬!您可以免费使用该脚本,但请记住,重新发布代码须遵守我们的网站规则。
免责声明
这些信息和出版物并非旨在提供,也不构成TradingView提供或认可的任何形式的财务、投资、交易或其他类型的建议或推荐。请阅读使用条款了解更多信息。