OPEN-SOURCE SCRIPT
已更新 EMA_cumulativeVolume_crossover [indicator]
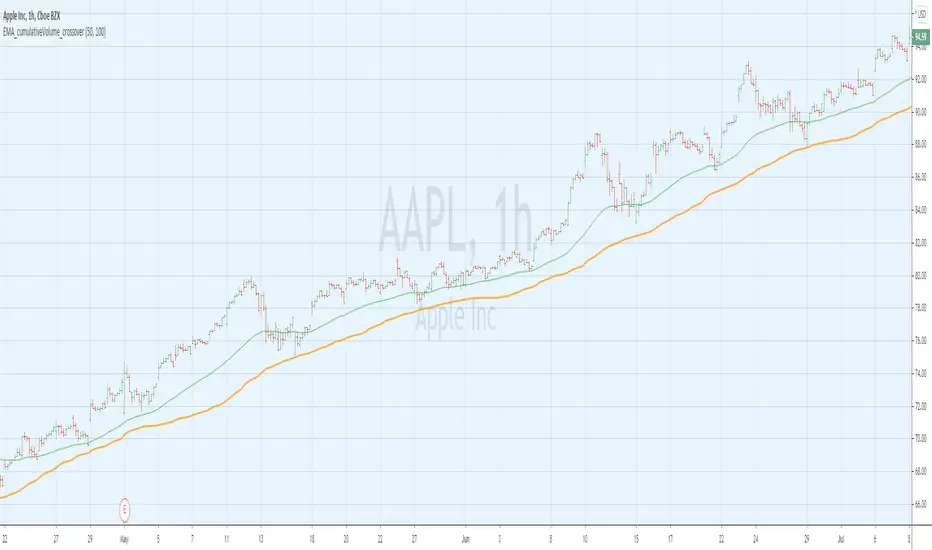
while I was doing some research with exp MA crossovers and volume indicator , I have noticed that when ema 50 is above cumulative volume of 100 period , shows to capture nice profits in that trend. Shorting also (ema50 cross down volume of 100 period) also shows nice results.
BUY
When ema50 crossover cumulative volume of 100 period
Exit
When ema50 cross down cumulative volume of 100 period
Short Selling
Reverse above BUY conditions
Back ground color shows blue when ema50 is above cumulative volume of 100 period, shows purple when ema50 is below cumulative volume of 100 period
I will publish the strategy for back testing later today
Warning
For the use of educational purpose only
版本注释
variable name corrected ... 开源脚本
秉承TradingView的精神,该脚本的作者将其开源,以便交易者可以查看和验证其功能。向作者致敬!您可以免费使用该脚本,但请记住,重新发布代码须遵守我们的网站规则。
免责声明
这些信息和出版物并非旨在提供,也不构成TradingView提供或认可的任何形式的财务、投资、交易或其他类型的建议或推荐。请阅读使用条款了解更多信息。
免责声明
这些信息和出版物并非旨在提供,也不构成TradingView提供或认可的任何形式的财务、投资、交易或其他类型的建议或推荐。请阅读使用条款了解更多信息。