INVITE-ONLY SCRIPT
VWAP Momentum Band
How to use:
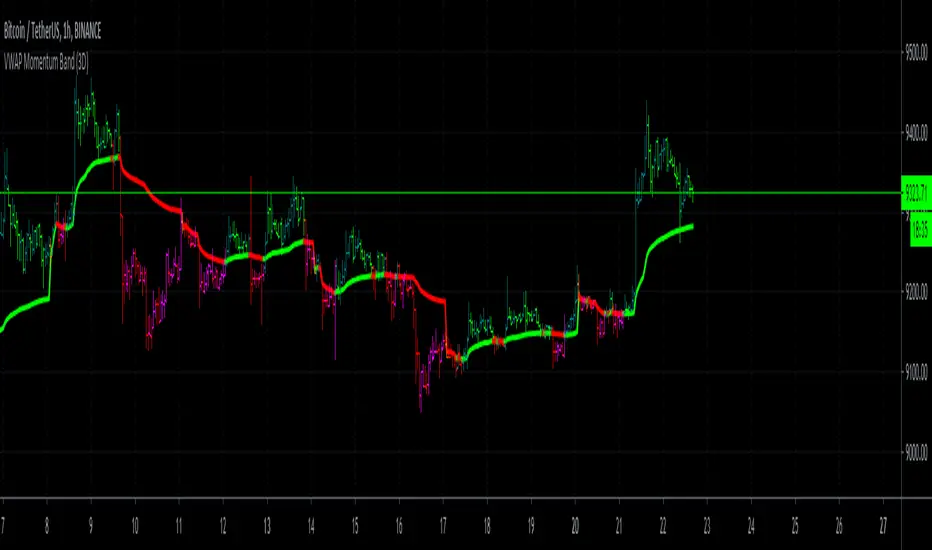
This should always be used in a bar chart. You as a trader actually just have to look for the color of the band in the middle, it tries to indicate you the coming up price action it also shows you where there is gaining momentum into your direction.
Band is green, what to do ?
Shown with the darker green candles and loosing momentum with the lighter green candles for the upward direction.
Band is red, what to do ?
Shown with the darker red color is momentum to the downwards direction and pink or lighter red color in the bars indicate loosing momentum to the downward direction.
If used correctly this indicator can also be used to feed trading bots via the Trading View Alerts.
Here are a few chart examples:

For example this for daytrading Tesla Stock.
Or daytrading NIO

If there are any questions left open, please send us a direct message!
This should always be used in a bar chart. You as a trader actually just have to look for the color of the band in the middle, it tries to indicate you the coming up price action it also shows you where there is gaining momentum into your direction.
Band is green, what to do ?
Shown with the darker green candles and loosing momentum with the lighter green candles for the upward direction.
Band is red, what to do ?
Shown with the darker red color is momentum to the downwards direction and pink or lighter red color in the bars indicate loosing momentum to the downward direction.
If used correctly this indicator can also be used to feed trading bots via the Trading View Alerts.
Here are a few chart examples:
For example this for daytrading Tesla Stock.
Or daytrading NIO
If there are any questions left open, please send us a direct message!
仅限邀请脚本
只有作者授权的用户才能访问此脚本。您需要申请并获得使用许可。通常情况下,付款后即可获得许可。更多详情,请按照下方作者的说明操作,或直接联系NEXT-LEVEL。
TradingView不建议您付费购买或使用任何脚本,除非您完全信任其作者并了解其工作原理。您也可以在我们的社区脚本找到免费的开源替代方案。
作者的说明
免责声明
这些信息和出版物并非旨在提供,也不构成TradingView提供或认可的任何形式的财务、投资、交易或其他类型的建议或推荐。请阅读使用条款了解更多信息。
仅限邀请脚本
只有作者授权的用户才能访问此脚本。您需要申请并获得使用许可。通常情况下,付款后即可获得许可。更多详情,请按照下方作者的说明操作,或直接联系NEXT-LEVEL。
TradingView不建议您付费购买或使用任何脚本,除非您完全信任其作者并了解其工作原理。您也可以在我们的社区脚本找到免费的开源替代方案。
作者的说明
免责声明
这些信息和出版物并非旨在提供,也不构成TradingView提供或认可的任何形式的财务、投资、交易或其他类型的建议或推荐。请阅读使用条款了解更多信息。