OPEN-SOURCE SCRIPT
Dodgy Volume Oscillator
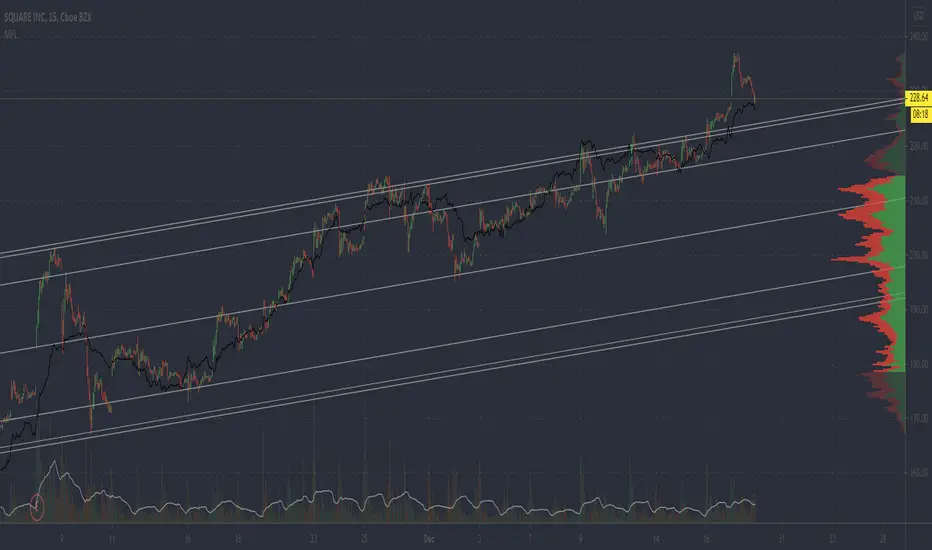
This is something between a money flow moving average and a volume oscillator. To be honest, I don't really understand the math I used, but it compares the volume to the price and charts it similarly to a moving average. Input of 100 seems to work well on shorter time frames, consider lowering this for higher time frames.
I am still testing this and it seems to give of many false positives, be careful!
I am still testing this and it seems to give of many false positives, be careful!
开源脚本
秉承TradingView的精神,该脚本的作者将其开源,以便交易者可以查看和验证其功能。向作者致敬!您可以免费使用该脚本,但请记住,重新发布代码须遵守我们的网站规则。
免责声明
这些信息和出版物并非旨在提供,也不构成TradingView提供或认可的任何形式的财务、投资、交易或其他类型的建议或推荐。请阅读使用条款了解更多信息。
开源脚本
秉承TradingView的精神,该脚本的作者将其开源,以便交易者可以查看和验证其功能。向作者致敬!您可以免费使用该脚本,但请记住,重新发布代码须遵守我们的网站规则。
免责声明
这些信息和出版物并非旨在提供,也不构成TradingView提供或认可的任何形式的财务、投资、交易或其他类型的建议或推荐。请阅读使用条款了解更多信息。