INVITE-ONLY SCRIPT
PT Trend Bars
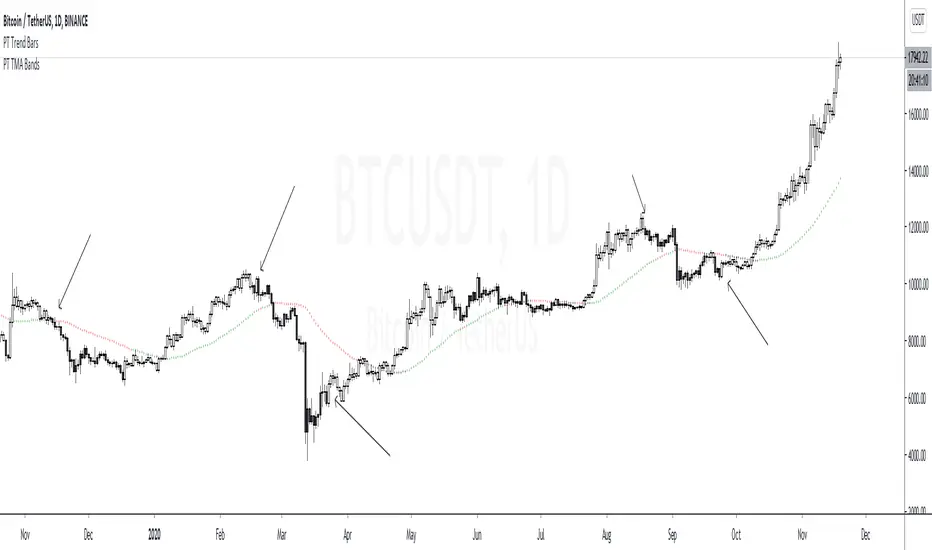
Version 1.0 of our Trend Bars Indicator offers a visual of the current trend. The purpose of it is to help you avoid counter trading the trend. It will not identify the exact top or bottom, but it will help you identify overall in which direction the market wants to head. High time frame trend bar candles will allow you to ride the wave for multiple weeks.
White candles indicate bullish trend
Black candles indicate bearish trend
Strategy:
Daily is our favorite time frame to use when trying to identify the overall macro trend of the asset. Once we cross bull with three consecutive white candles, we can assume we are bullish until the candles flip bear again (black). On lower time frame, if the candles flip color but the price is going against trend, you can assume we are going for a retest.
This Oscillator is best used with the PT Buy Sell indicators we provide. It offers extra confluence for a stop loss & for a target for swing setups. It is included as part of the library. Just message us for access!
仅限邀请脚本
仅限作者授权的用户访问此脚本,并且通常需要付费。您可以将其添加到收藏中,但是只有在向作者请求并获得许可之后,才能使用它。 请联系patterntraders了解更多信息,或按照以下作者的说明操作。
TradingView不建议付费使用脚本,除非您100%信任作者并了解脚本的工作原理。在许多情况下,您可以在我们的社区脚本免费找到不错的开源替代方案。
作者的说明
″
想在图表上使用此脚本?
警告:请在申请访问权限之前阅读。
Join our telegram & discord for updates on our indicators & setups
✔ Website: whop.com/patterntraders
✔ Telegram: t.co/svvfkV3H7I?amp=1
✔ Discord: discord.gg/bqvYxc3
✔ Twitter: twitter.com/onlypatterns
✔ Website: whop.com/patterntraders
✔ Telegram: t.co/svvfkV3H7I?amp=1
✔ Discord: discord.gg/bqvYxc3
✔ Twitter: twitter.com/onlypatterns
免责声明
这些信息和出版物并不意味着也不构成TradingView提供或认可的金融、投资、交易或其它类型的建议或背书。请在使用条款阅读更多信息。