PROTECTED SOURCE SCRIPT
EMA DEMA Cross Study - KB
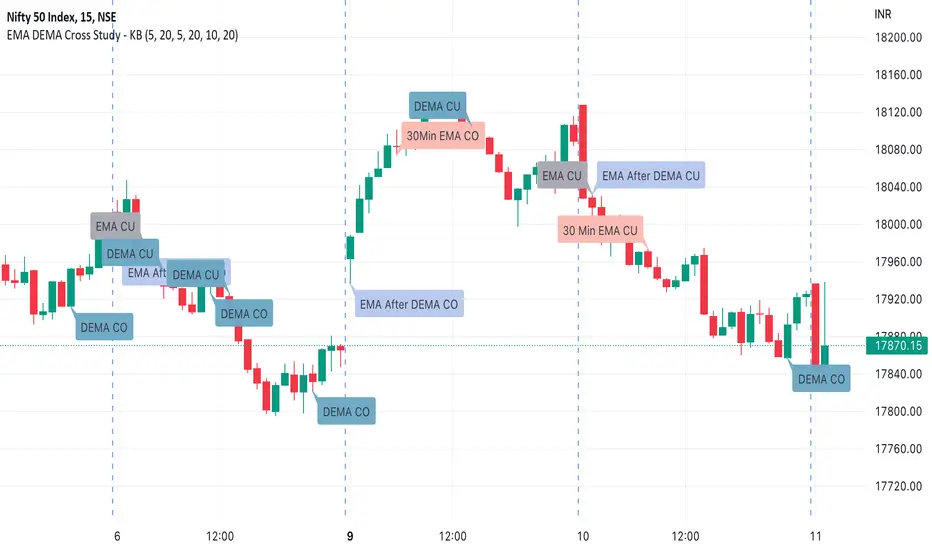
This script is created to check cross of two EMAs after their DEMA cross (for Nifty and BankNifty). It also has an option to show the cross as it happens in the 30 min timeframe on the lower timeframe chart.
Pls Note - This is for study purpose only and one shouldn't open a trade based on the cross. This script was created keeping 15 min timeframe as the default.
This script gives visual sign for a crossover and crossunder. It has 4 options
1. DEMA cross
2. EMA cross
3. EMA cross only after DEMA cross in the same direction. See the attached snapshot. First cross is as expected EMA (green shades line) after DEMA (purple shade lines), however second cross is not valid as EMA cross happened before DEMA in that direction - hence this wont be a valid scenario for this option.

4. 30 Min 10/20 EMA cross. Usually to see a crossover in 30 min one has to select 30 min time on chart. In this option script is taking the 30 min close price to calculate EMA to check the cross even if you are on 15 min chart
In case labels are behind the price bars, just change the visual order to bring them to front for better readability
Pls Note - This is for study purpose only and one shouldn't open a trade based on the cross. This script was created keeping 15 min timeframe as the default.
This script gives visual sign for a crossover and crossunder. It has 4 options
1. DEMA cross
2. EMA cross
3. EMA cross only after DEMA cross in the same direction. See the attached snapshot. First cross is as expected EMA (green shades line) after DEMA (purple shade lines), however second cross is not valid as EMA cross happened before DEMA in that direction - hence this wont be a valid scenario for this option.
4. 30 Min 10/20 EMA cross. Usually to see a crossover in 30 min one has to select 30 min time on chart. In this option script is taking the 30 min close price to calculate EMA to check the cross even if you are on 15 min chart
In case labels are behind the price bars, just change the visual order to bring them to front for better readability
受保护脚本
此脚本以闭源形式发布。 但是,您可以自由使用,没有任何限制 — 了解更多信息这里。
免责声明
这些信息和出版物并非旨在提供,也不构成TradingView提供或认可的任何形式的财务、投资、交易或其他类型的建议或推荐。请阅读使用条款了解更多信息。
受保护脚本
此脚本以闭源形式发布。 但是,您可以自由使用,没有任何限制 — 了解更多信息这里。
免责声明
这些信息和出版物并非旨在提供,也不构成TradingView提供或认可的任何形式的财务、投资、交易或其他类型的建议或推荐。请阅读使用条款了解更多信息。